USDC Deposits into Pool Together
Q1. In the last month, how much USDC did users deposit into PoolTogether (Ethereum)? What’s the average deposit amount per user?
PoolTogether is a crypto-powered savings protocol based on Premium Bonds. Save money and have a chance to win every week.
- Funds deposited into Pool Together will be rerouted to other yield-bearing protocols
- Users who deposit fund stands a chance to win prizes from yield generated from the pot of funds
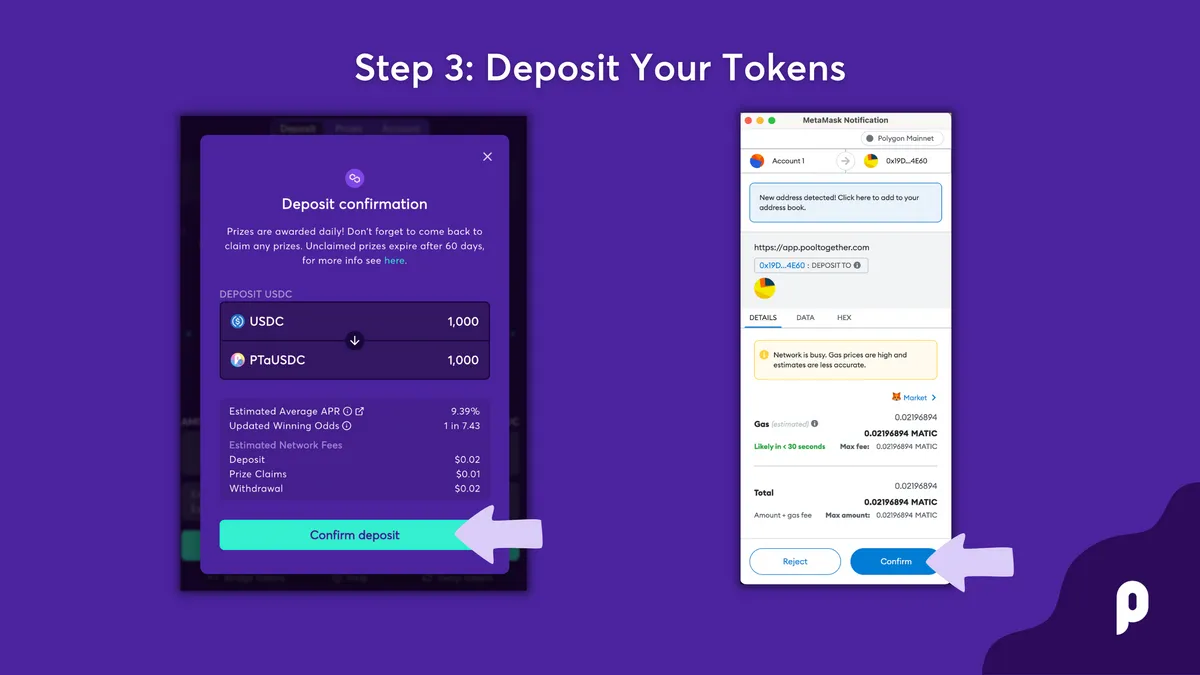
Users will receive a PTaUSDC as a receipt for depositing USDC into PoolTogether.
Approach
- We will trace the amount of USDC being sent to the USDC deposit contract for PoolTogether in the last 30 days using the ez_token_transfers table one flipside
- The deposits analysed were filtered to the last 30 days
This was not accounting withdrawals made from the pool.
The chart above shows the number of distinct users and deposits (tx_count) made to the USDC deposit pool in the last 30 days. We see that the tx count is always higher than the unique user count, suggesting that some users deposited more than once when interacting with the contract.
The average amount of USDC deposited was 241k while the median amount was 456 USDC. The median amount tells us that for half of the users depositing in the last 30 days deposited at least 456 USDC.
The wide difference between the average and the median suggests that whales deposited a higher amount of USDC (3.3M), distorting the average (averages are sensitive to outliers.)
This is evident when we chart the median and average deposits over time - the amount varies significantly from week to week.