Flipside Crypto: Learn to Solve Algorand Bounties
New to Flipside Crypto and Algorand? No fear, your comprehensive step-by-step tutorial is here. Learn how to use SQL to discover and visualize the volume of Algorand token moved daily to and from centralized exchanges (CEXs).
0c. What are CEXs? 💸
Centralized Exchanges, or CEXs, are a widely used type of platform where crypto users can trade tokens. They are centralized in a way that a traditional exchange (for stocks or physical commodities) is centralized: a central intermediary (the exchange) is the trusted party that facilitates all transactions and ensures the safekeeping of balances (ideally, although in reality hacks are not uncommon). CEXs also offer the option to exchange between cryptocurrencies and fiat money (dollars, euros etc. issued by governments), depositing money into the crypto ecosystem or withdrawing it. The trading that happens within a centralized exchange stays off-chain (is not recorded in the blocks of the blockchain). But what is visible on-chain are the transactions where crypto wallets interact with a CEX, by either sending tokens there or withdrawing them.
Centralized? I thought the whole point of blockchain was to decentralize?
In a broad sense, CEXs can be seen as an echo of the traditional, pre-blockchain financial system. They bridge the gap between the form of trading people already knew how to do (and how to organize), and the possibilities that crypto offers. They present a common way to buy into crypto with fiat money, which allows crypto 'non-natives' to onboard onto the ecosystem, and for many users to continue operating with one foot in fiat and another in crypto. Among the downsides of CEXs are a lack of transparency (remember, their internal transactions are not recorded to the blockchain for all to examine), and due to their centralized nature - an increased vulnerability to hacks/crashes/etc. and subsequent loss of money, or personal information they are required to collect.
As an alternative, the world of blockchain has seen Decentralized Exchanges (DEXs) spring up. The organizing principle of DEXs is more consistent with the broader idea behind crypto, which is decentralization. At DEXs users trade tokens with one another (peer-to-peer) without the use of a central intermediary. Automatically-executed programs called smart contracts enable the infrastructure to run. Another way to participate in DEX activity, in addition to trading, is for users to provide liquidity - lock in some of their tokens in pairs for a set amount of time to enable others to trade with those; in exchange for a percentage return (yield). An alternative to the pitfalls of centralized trading, DEXs are gaining ground, but for now CEXs seem to retain their first-comer advantage.
An advantage of blockchain is that the data on amounts, transactions, balances etc. is open (yet anonymous) and available for anyone to access and analyze. As mentioned above, CEXs pose somewhat of a barrier for that, but it is still possible to pinpoint blockchain transactions happening to and from CEXs.
This article gives a tutorial on working with on-chain data on Flipside Crypto for the Algorand protocol and its ALGO governance token. Many approaches shown here will apply to analyzing and visualizing other sections of Algorand data, as well as data on Flipside for other protocols.
In this tutorial, we will will try to understand the popularity of ALGO on centralized exchanges: how much ALGO (by volume) is transacted to and from CEXs.
Step 1: Asking the analysis question 🤔
This analysis will assess the popularity of the ALGO token on centralized exchanges.
We will ascertain the volume of ALGO moved to and from CEXs since the beginning of 2021 by:
- charting the volume of ALGOs moved to each CEX per day, and
- charting the volume of ALGOs moved from each CEX per day in this time period.
Step 2: Accessing the data 🗝
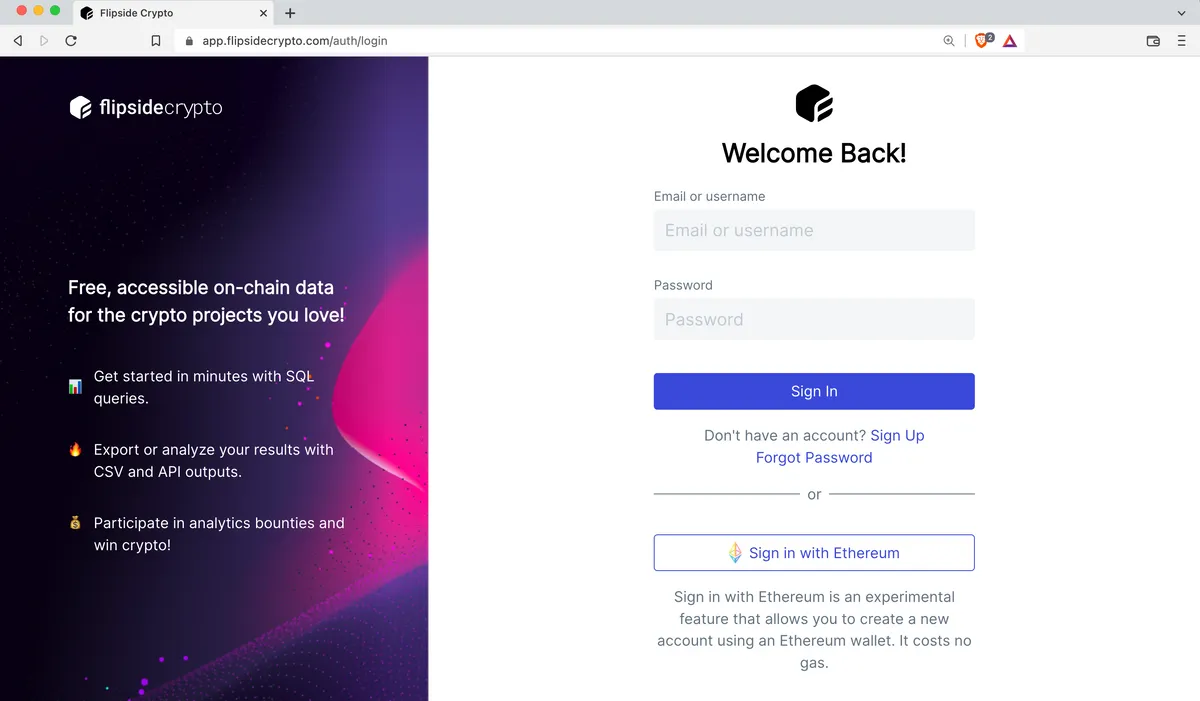
Flipside Crypto data is accessed on the Velocity web app.
You are able to browse other users' queries without signing in, but the source data and otherwise full functionality is available after you sign up for a free account, and log in: https://app.flipsidecrypto.com/auth/login
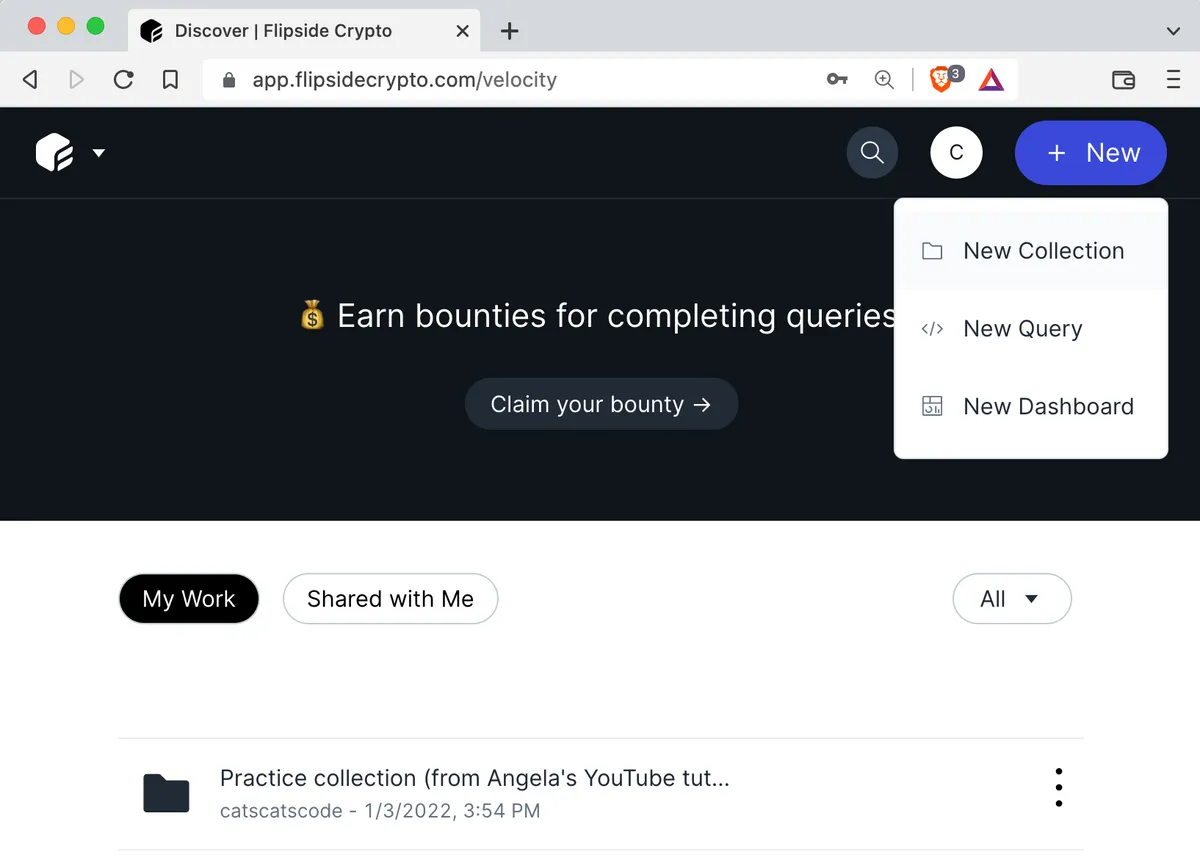
After logging in, create a new collection (a folder for SQL queries). You can name your collection (for example this one is called "Algorand CEX Tutorial"):
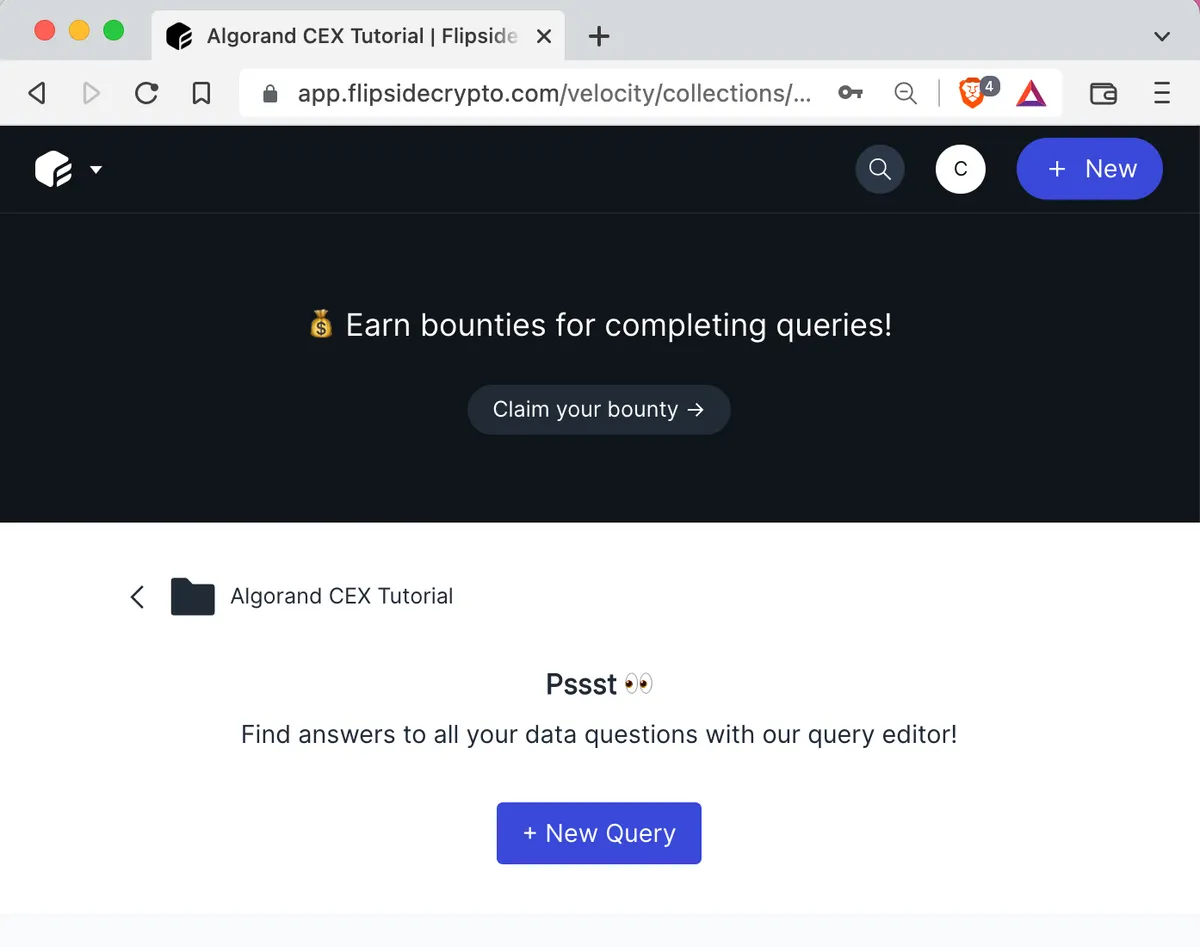
Inside your collection, create a new query - this is how you will be able to interact with data:
Explore the dropdown list of schemata on the upper left side. For this analysis we need to select the algorand schema:
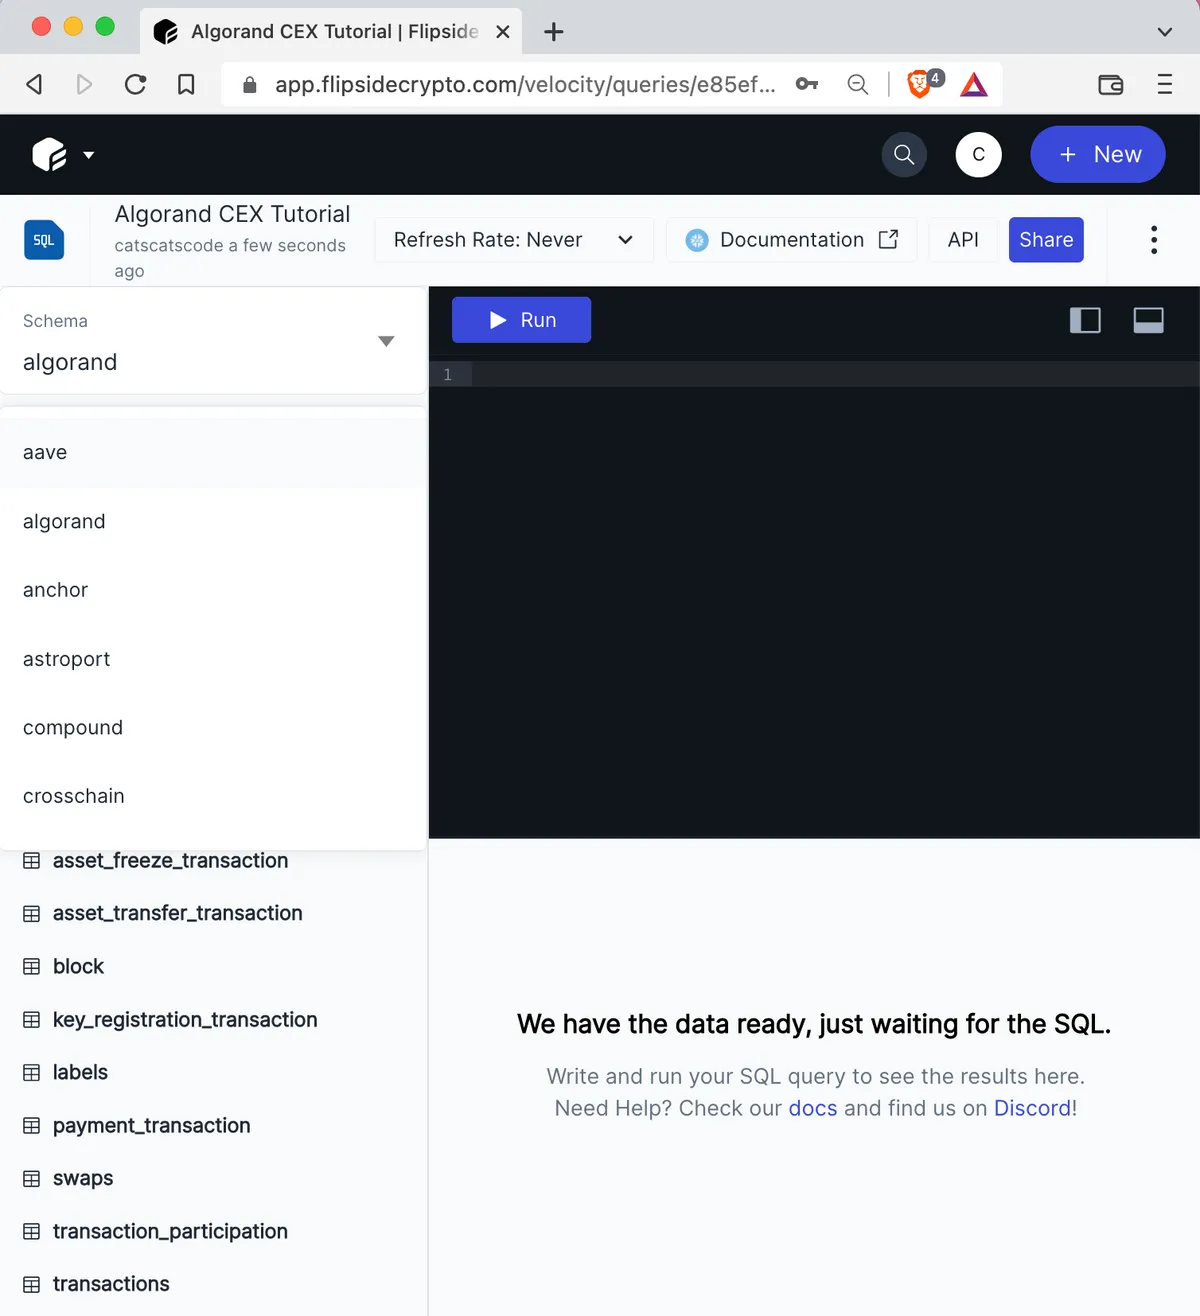
Once your desired schema (e.g. algorand) is selected, under it you will see the list of all tables contained in that schema.
Clicking on a table name will reveal the variables (columns) it contains.
Clicking on each variable/column name will provide additional details about the variable (at the time of writing this some descriptions are still in progress).
Also here is of my favorite Flipside features - table preview. If you click on Preview, you get a sneak peek at the first ten rows of data as an example of what the table contains, all without having to write a single query of your own.
Step 3: Time to write SQL queries! ⚒️
3a. Wait, what was the question again? 🤔
As a reminder, we will try to find the volume of ALGO token moved to CEXs and from CEXs per day since the start of 2021.
3b. What CEXs are represented in the data? Which ones can we analyze?
Many Flipside schemas contain a labels table, which helps analysts make better sense of some of the data found in other tables. Let's look at the algorand labels table to identify the CEXs.
As a reminder, you can explore the labels table like any other by clicking Preview. Or, you can run a manual SQL query which calls for the first few rows (e.g. 10 rows) of all the columns. Both exploration options are shown here:
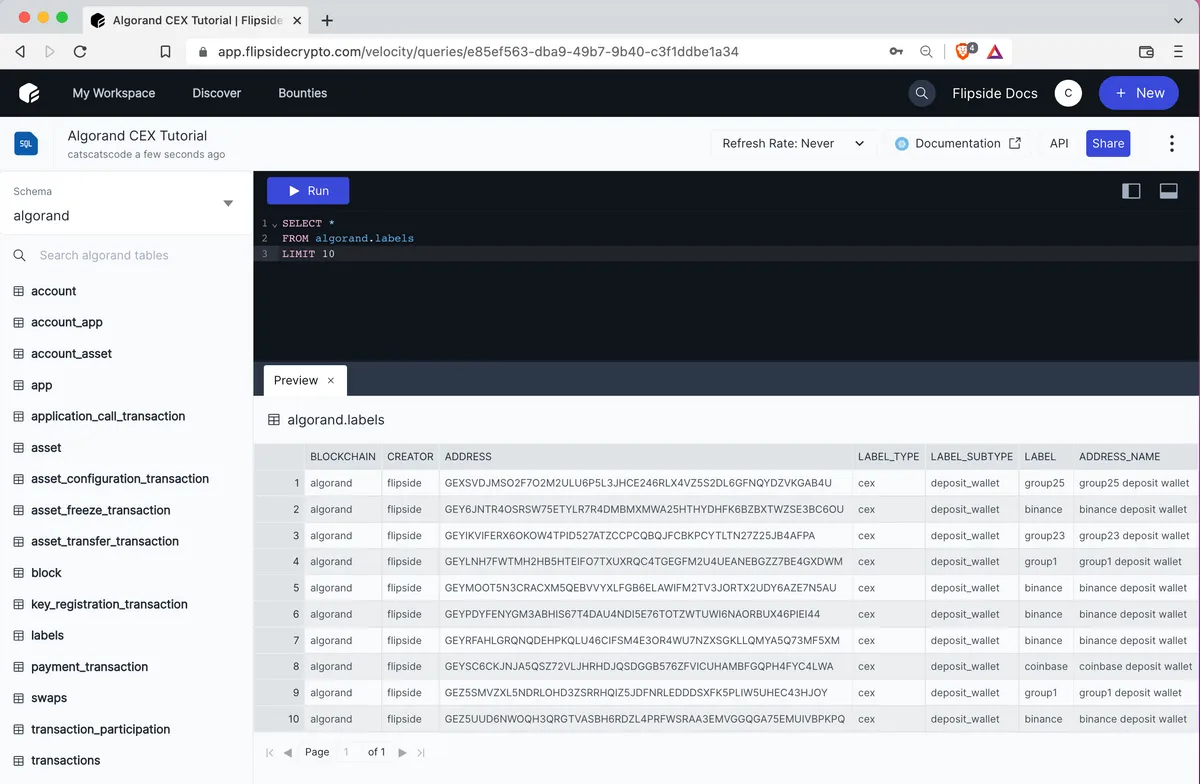
In the above table, we see rows where label_type is 'CEX', and some (probably familiar) CEX names in the label column: Binance, Coinbase, and something called 'groups' of CEXs.
What are these groups? Well, it will be up to you as the analyst to discover answers to such questions. Wise Flipside community analysts before us surmised that smaller CEXs may be bunched together in groups like these. You can make the case to continue the analysis only with the 'named' CEXs from our data. Just make sure to spell out assumptions like these when you write up your analysis, so that readers can understand and possibly replicate your process.
3c. First SQL query
Now that we know where to find CEX names, the next step is to get a list of all CEXs in our data.
3d. Now we can find the volume of ALGO sent to and from CEXs every day.
For this, the payment_transaction table will be helpful.
Why the payment_transactions table and not just the transactions table?
This is the kind of question you can answer as you poke around in the tables, and some of it will also become clearer as you gain more Flipside exposure. If you look at the transactions table you can see that lots of data is packed into the tx_message field in JSON format. This is format is closer to the data source, this is what some of the data looks like when extracted. There is a way to unpack this kind of data with SQL – you can look up tutorials for flattening JSON.
But the payment_transactions table offers a faster, more direct path to such data. Flipside team puts lots of work into transforming the data and making it more human-readable, and payment_transactions is one such transformed table, where transaction amounts are shown in their own column without the need to go digging in a catch-all JSON column.
Volume of ALGO sent to CEXs
The query below will give us the transaction volume in ALGO, only for those transactions where a CEX was on the receiving end.
To get this data, we will combine (JOIN) the algorand labels table and the algorand payment_transaction table, to connect each transaction with the label for its destination.
This SQL query is inspired by the analytics dashboard created by the user Yellow.
Step 4: How to visualize data? 🎨
On Flipside Crypto, built-in tools make visualization straightforward.
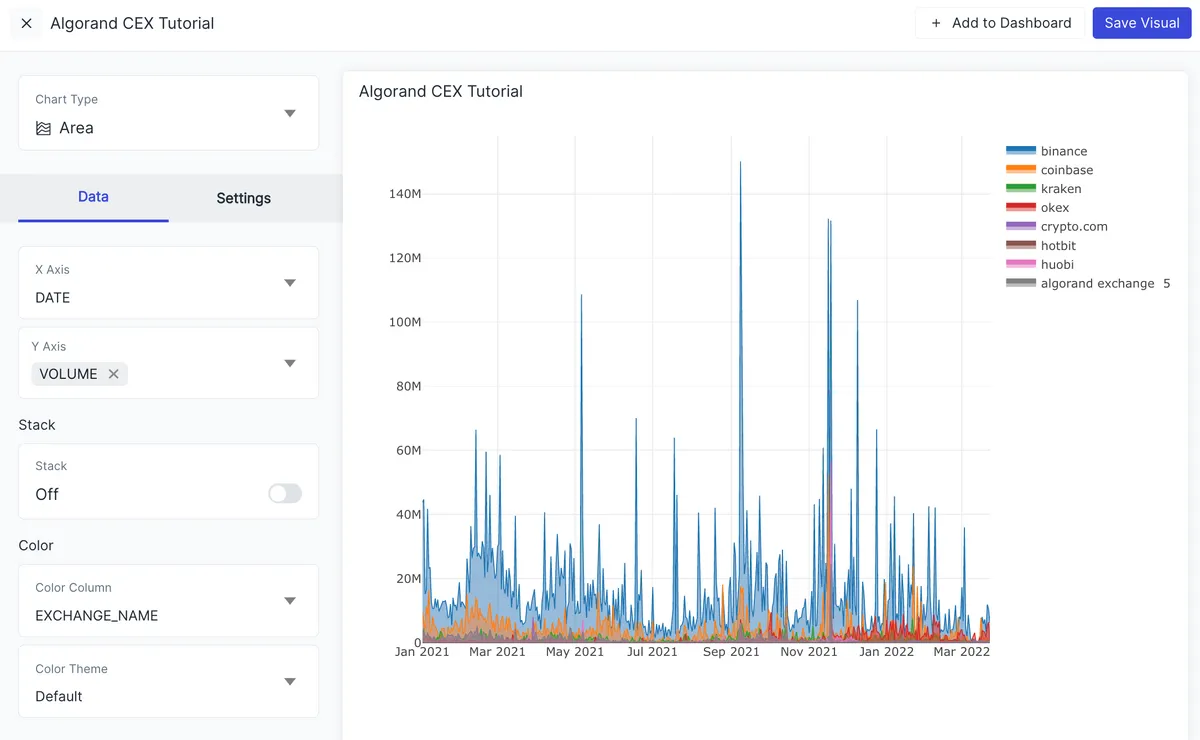
Click on the "New Chart" button next to "Results", and you will get access to a chart interface where you can customize your chart with the following:
- a title,
- the chart type (single number, donut, bar, line, area, or scatterplot),
- the variables for the x axis and the y axis,
- the "color column", which allows to break up the y axis column into several parameters (for ex., in this analysis we can break up the volume column by
exchange_nameto chart each CEX separately), - data types (in Settings) - choose between linear/log/date (for example mark the date column as date format to ensure it displays correctly),
- toggle the legend on/off,
- set the data types of the axes,
- change the color scheme, etc.
When you've made your chart, click "Add to Dashboard" on top, where you can create a new dashboard where your analysis will go (or add to an existing dashboard). Your dashboards are available from the main menu on top of the page, under "My Workspace", and clicking on the dashboard will open it in edit mode.
An embedded interactive chart of ALGO volume sent daily to CEXs will look like this:
Step 5: Publishing the dashboard 📊
In dashboard edit mode, in addition to embedding interactive Flipside charts into your analytic dashboard, you can add text blocks, images, and headers to flesh out your analysis and present your findings.
Click "Publish" on a finished dashboard to enable you to share the public link!
Let's run more queries and make more charts before we move on to creating a dashboard and sharing our analysis with the world.
Here is an area chart for the amount ALGO transferred daily from CEXs (constructed the same way as the previous chart):
Hi and welcome, analyst! 👋 In this tutorial you will learn to solve bounties on Flipside Crypto: from creating your account, to exploring the data, writing SQL queries, visualizing your findings, and presenting them in a comprehensive dashboard ready to share and submit. You will also gain an understanding of Algorand data on Flipside, and do an analysis to find out the popularity of ALGO token on centralized crypto exchanges.
Let's get into it!

Step 0: What is... everything? 🧐
0a. What is Flipside Crypto?
Flipside Crypto is a blockchain data & community analytics platform. Anyone can sign up to explore the data for multiple protocols and chains using SQL, create visualizations and dashboards with built-in tools, and share and discuss the results with the Flipside community and broader public.
0b. What is Algorand? Is there any difference between Algorand and ALGO?
Algorand is a L1 & L2 (two-level) proof-of-stake blockchain protocol that enables fast transactions for DeFi (decentralized finance), NFTs, and other crypto use cases; and yes, Flipside has the data schema for it.
ALGO is Algorand's native token.
✏️ And here is what this SQL query means line-by-line:
- unique (distinct) values of the
labelcolumn, - from the
algorand_labelstable, - where the label belongs to a CEX,
- excluding those label names that start with 'group',
- for ease of skimming the table we order the results alphabetically by label name (optional especially if you don't plan on displaying the table itself in your analysis).
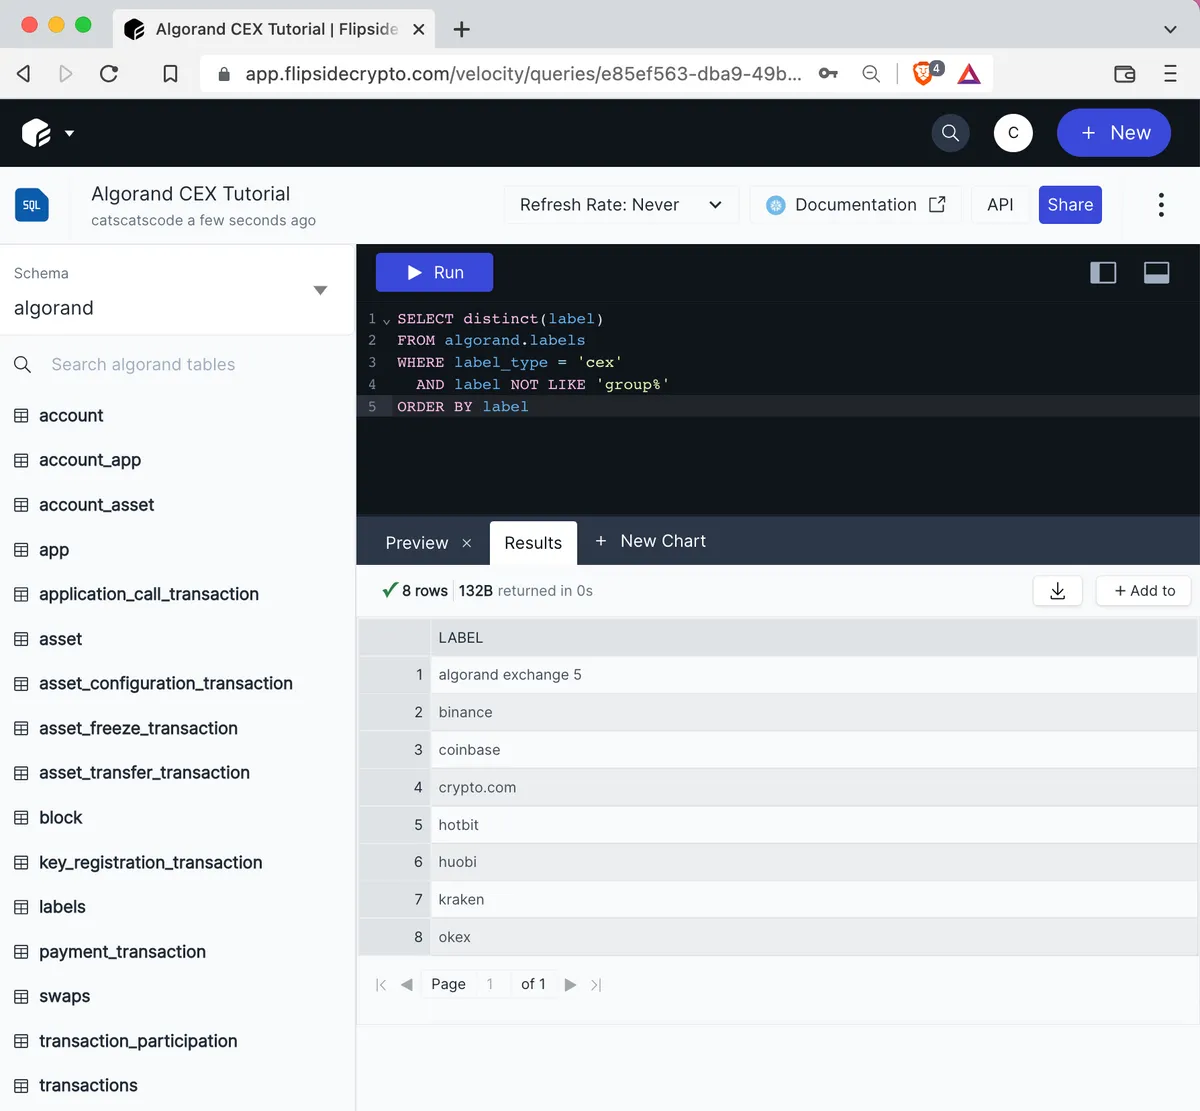
💻 Here is the SQL code you need:
SELECT distinct(label)

FROM algorand.labels

WHERE label_type = 'cex'

  AND label NOT LIKE 'group%'

ORDER BY label
In Flipside Crypto's Velocity it will look like this:
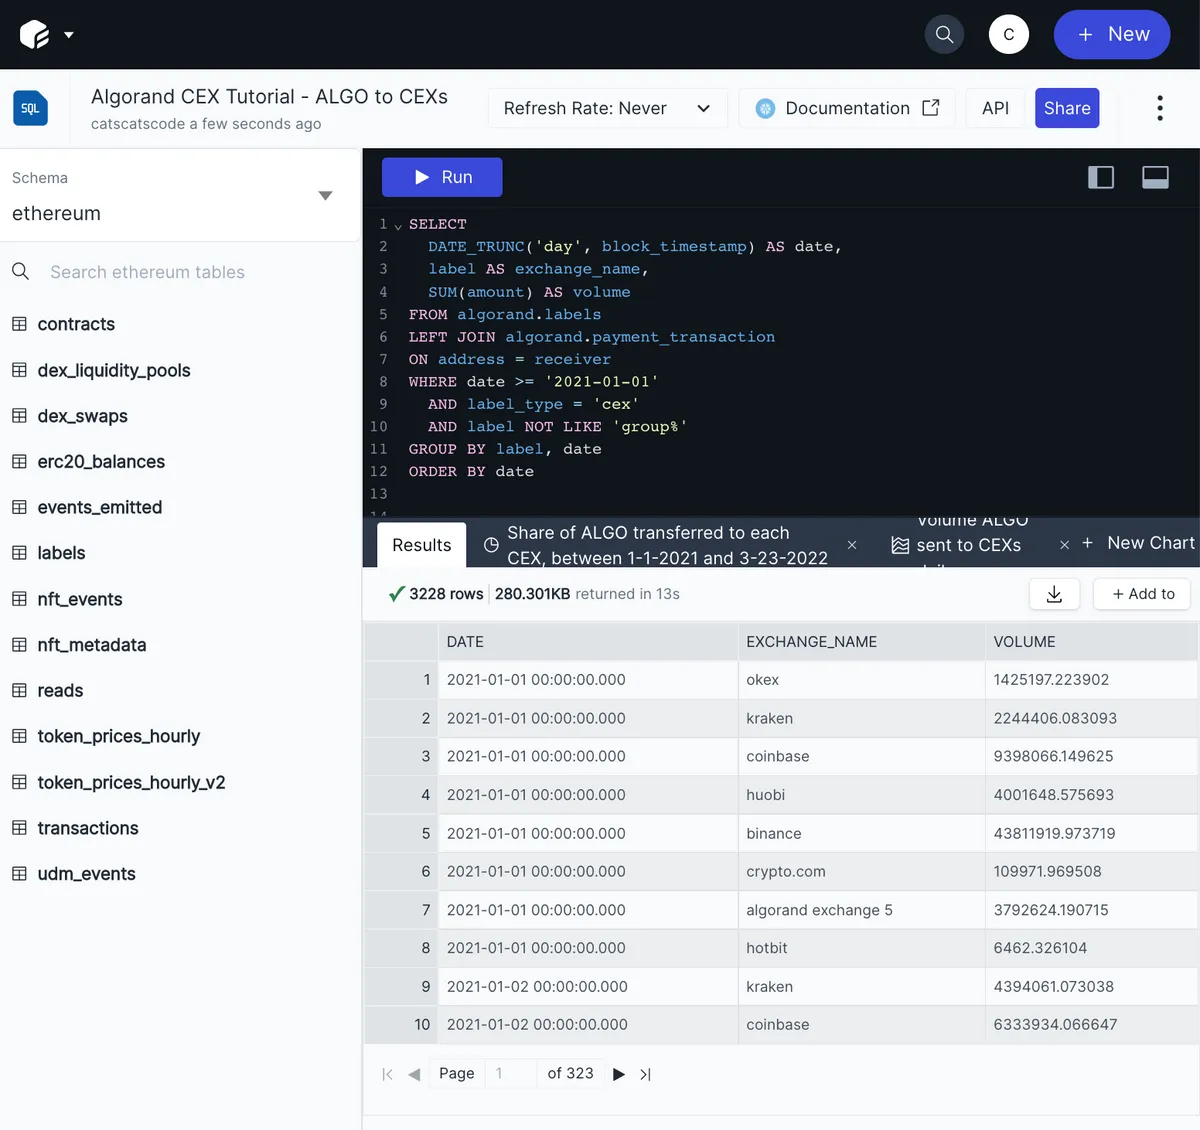
💻 The SQL for the amount of ALGOs moved to CEXs:
SELECT

  DATE_TRUNC('day', block_timestamp) AS date,

  label AS exchange_name,

  SUM(amount) AS volume

FROM algorand.labels

LEFT JOIN algorand.payment_transaction

ON address = receiver

WHERE date >= '2021-01-01'

  AND label_type = 'cex'

  AND label NOT LIKE 'group%'

GROUP BY label, date

ORDER BY date
✏️ And a human version:
- the main event happens on lines 5-7 of the query: we join the two tables and only select from them the rows where a CEX wallet address was the recipient (
ON address = receiver, address is a column from the labels table, and receiver is also a column of wallet addresses but from the payment transactions table); - then we go back up to lines 1-4: here we can select relevant columns from either/both of the joined tables, or transform them to create new columns (if column names were not unique across tables then we would need to prefix the variable name with the table name and a period);
- on line 2, the DATE_TRUNC function extracts year, month, and day from the timestamp of a block (we specify 'day' as we don't need to go deeper than the day, e.g. not hour or minute);
- the SUM function will give us a sum of transaction amounts for each day;
- in the WHERE clause we use the same filters as in the previous query, to give us CEXs that aren't called 'group', plus we choose tofilter out the transactions before 2021;
- GROUP BY clarifies by which categories we want to aggregate: for instance here we get SUM on each date and to each CEX.
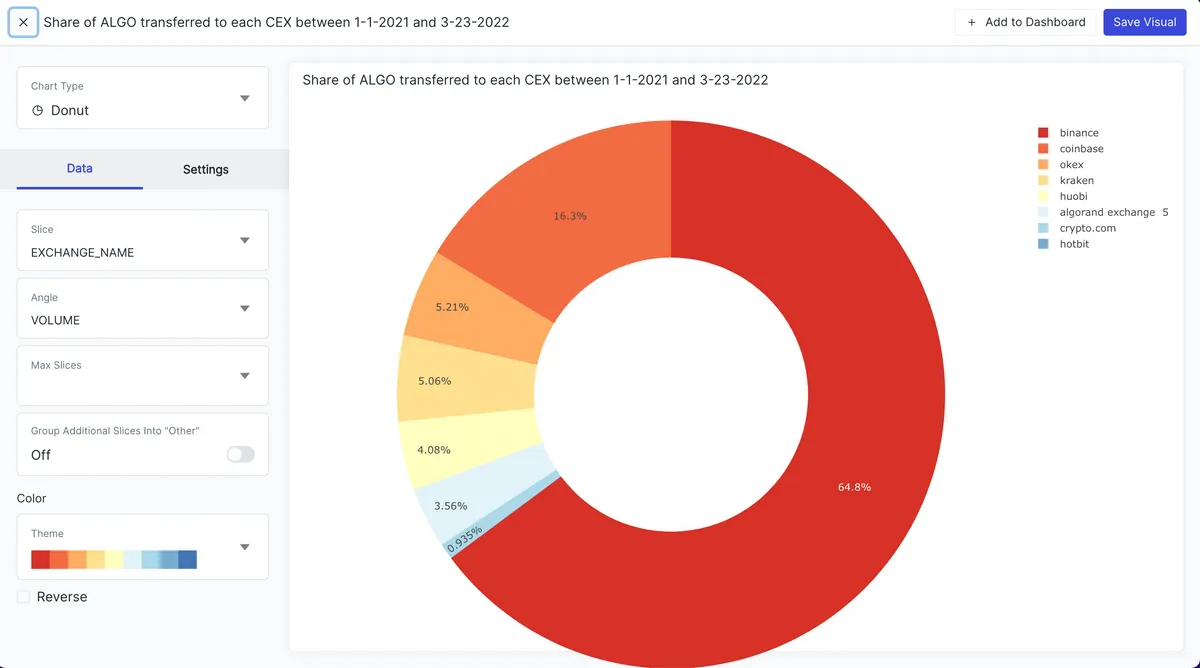
You can display the results of a query in a variety of other ways that provide new insights. For instance, our two queries can help us visualize the share of total ALGO volume sent to and from CEXs that belongs to each CEX.
An example of Velocity app settings for the donut chart:
The interactive results below show that in this time period, of the CEXs that received ALGO, Binance received the most by far (nearly 65%), followed by Coinbase (16%):
Volume of ALGO sent to CEXs
This is a similar query to the previous one, so let's get straight into the SQL code.
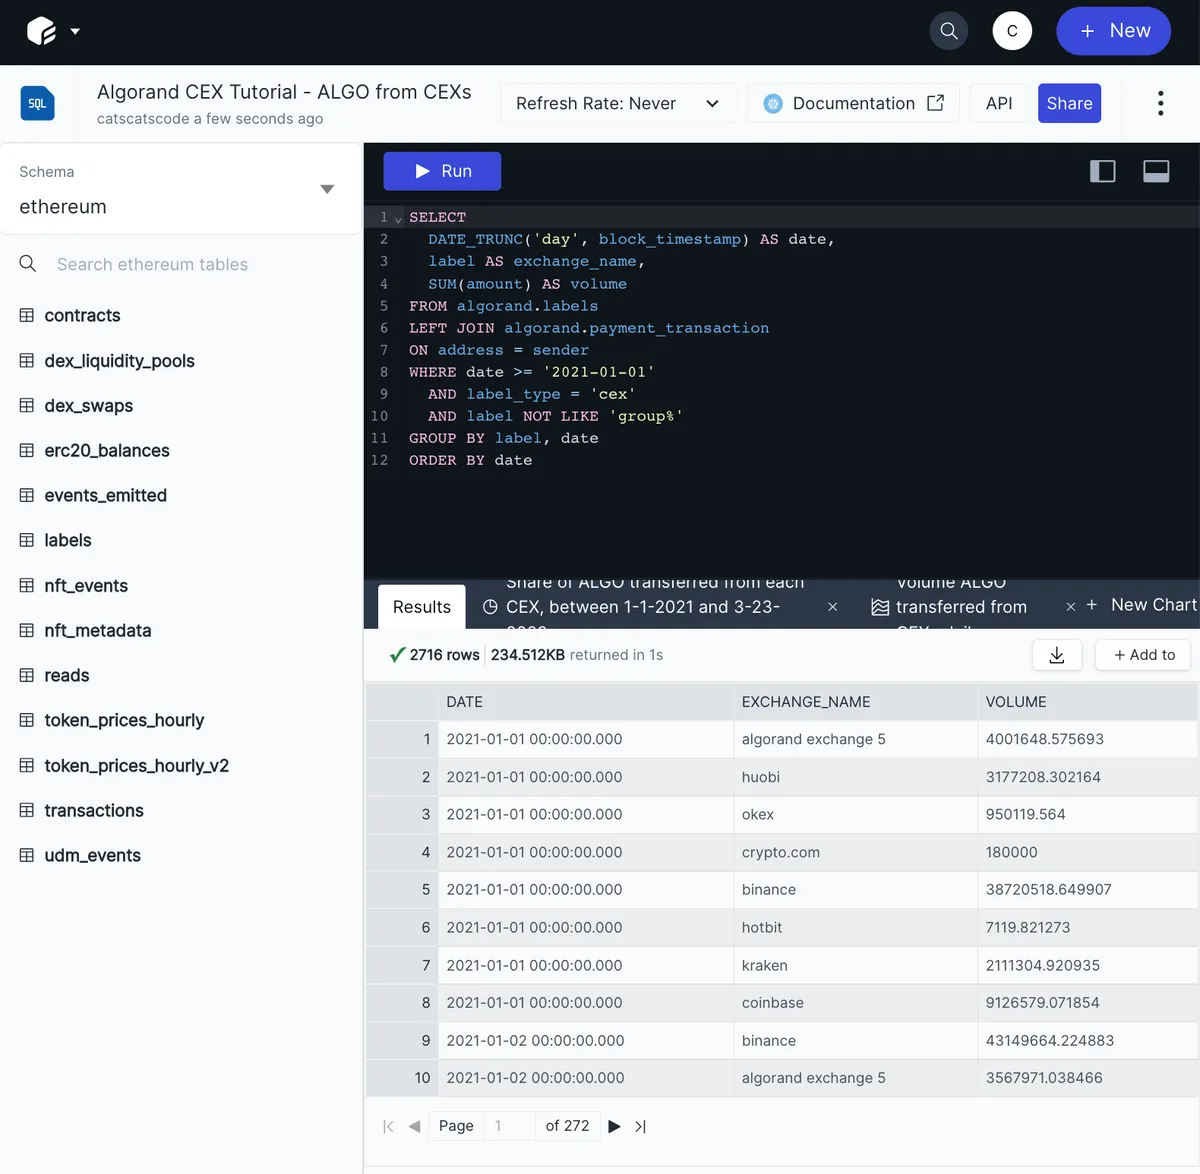
💻 The SQL for the amount of ALGOs moved from CEXs:
SELECT

  DATE_TRUNC('day', block_timestamp) AS date,

  label AS exchange_name,

  SUM(amount) AS volume

FROM algorand.labels

LEFT JOIN algorand.payment_transaction

ON address = sender

WHERE date >= '2021-01-01'

  AND label_type = 'cex'

  AND label NOT LIKE 'group%'

GROUP BY label, date

ORDER BY date
✏️ The logic behind this SQL query is similar to the previous one, with one difference:
- on line 7, the two tables are joined on the CEX address being the sender, not the receiver.
Now that we have query results, we can visualize them to help answer the analysis question.
The interactive chart below shows that in this time period, the majority of all ALGO tokens transferred from CEXs came from Binance (more than 63%), followed by Coinbase:
In Velocity:
In Velocity: