Price Elasticity of Uniswap Swaps to Ethereum Gas Fees - Unigrants Bounty #12
-- Date: 3 June 2022. -- Author: mar1na (catscatscode). -- Bounty: [Unigrants] Bounty #12 – Gas price impact on Uniswap. -- Description: This dashboard analyzes the gas fees for Uniswap trades, and the impact they have on Uniswap.
^Image source
Methodology: Price Elasticity 💸
For this analysis, I will rely on an economic concept called "price elasticity". In economic theory, price elasticity represents sensitivity of purchasing behavior to price, i.e. to what extent a price increase deters purchases.
For Uniswap traders, price elasticity represents the sensitivity of users to the (highly variable) gas fees they are required to pay for swaps. Do high gas fees detract swappers?
Hypotheses:
-
Higher Ethereum gas fees are a disincentive for user swaps; they result in a decline in the number and amount of Uniswap swaps on Ethereum. In economic terms, swaps are highly elastic (i.e. sensitive) to the gas fees.
-
Because gas fees do not depend on the transaction amount but rather on network congestion, they are a fixed cost. As a result, expensive gas fees primarily discourage small swaps.
-
The launch of Uniswap on L2 networks with lower gas (Polygon, Optimism, and Arbitrum) has attracted some users away from Uniswap on Ethereum with its high gas fees. For this portion of the analysis, I zeroed in on Uniswap on Polygon, based on the availability of data on Flipside Crypto.
Data Findings 📊
1a. Preliminary Data Analysis: Uniswap Activity and Gas on Ethereum
Let's begin by getting a broad look at the evolution of daily Uniswap gas and swap activity (see the two charts below). According to the data visualized below, it appears that gas is more volatile than the number of Uniswap transactions.
This finding could go against hypothesis #1. This data suggests low, not high elasticity of swaps to gas fees: some swaps don't happen because gas fees are too high, but many swaps take place regardless of gas charges. To confirm this, let us look in more detail at the volatility of gas vs. the volatility of swaps and swap amounts (see section 1b).
The above chart reveals (especially after interactive examination of each swap size separately or in pairs) that swaps of all sizes demonstrate significant volatility.
One of the factors causing the changes in swap activity could be the gas price. However, to identify causality (i.e. if the gas price change directly caused the change in the number of swaps), an extended analysis is needed, with regression or other methods.
3. Did Uniswap launch on Polygon affect Uniswap usage on Ethereum?
The above interactive visualization shows that, while the number of Uniswap swaps on Ethereum has decreased since November 2021, the number of Uniswap swaps on Polygon has increased since its launch on the L2 chain, and especially peaked on Polygon in mid-May 2022.
Takeaways 💬
In regards to the price elasticity hypotheses, the data in this analysis showed that:
-
Uniswap swapping activity on Ethereum is not highly elastic aka not very responsive to the changes in gas fees, although it is somewhat elastic/responsive. Gas fees are notably more volatile than the number of swaps or amounts swapped.
-
However, when broken down by swap size, Uniswap swapping activity on Ethereum is quite volatile. This may be in part explained by factors other than gas fees, e.g. overall liquidity in the market, etc.
-
There has been some increase of Uniswap swaps on L2 chains, namely Polygon, coupled with a simultaneous decrease of swapping activity on Uniswap on Ethereum. Yet, while some Uniswap users may be migrating to other L2 chains with lower gas fees, Polygon's share of Uniswap activity in particular is relatively small.
Dashboard metadata
- Date: 3 June 2022
- Author: catscatscode (Flipside, Twitter)
- Bounty: Unigrants Community Analytics Program - Bounty #12 'Gas price impact on Uniswap'
- Acknowledgments: This dashboard from Flipside user Cryptoicicle helped calculate the Uniswap activity on Polygon.
Intro: Why gas matters for DeFi protocols ⛽️
Successful decentralized finance protocols put a lot of thought into designing and calibrating their fee structure for users who interact with their platforms. It is a delicate balancing act to secure a sustainable amount of protocol revenues, and at the same time remain attractive for users, including liquidity providers on one side and liquidity users on the other.
However, by interacting with a protocol, users also face fees that are outside of the protocol's control - network fees a.k.a. gas. After the protocol makes the decision to launch on a particular blockchain (be it a L1, L2, etc.), it is exposed to that blockchain's usage incentives or dis-incentives, depending on how much gas costs. In Uniswap's case, as its initial launch (and main operation) is on Ethereum, the users are exposed to Ethereum's gas fee fluctuations.
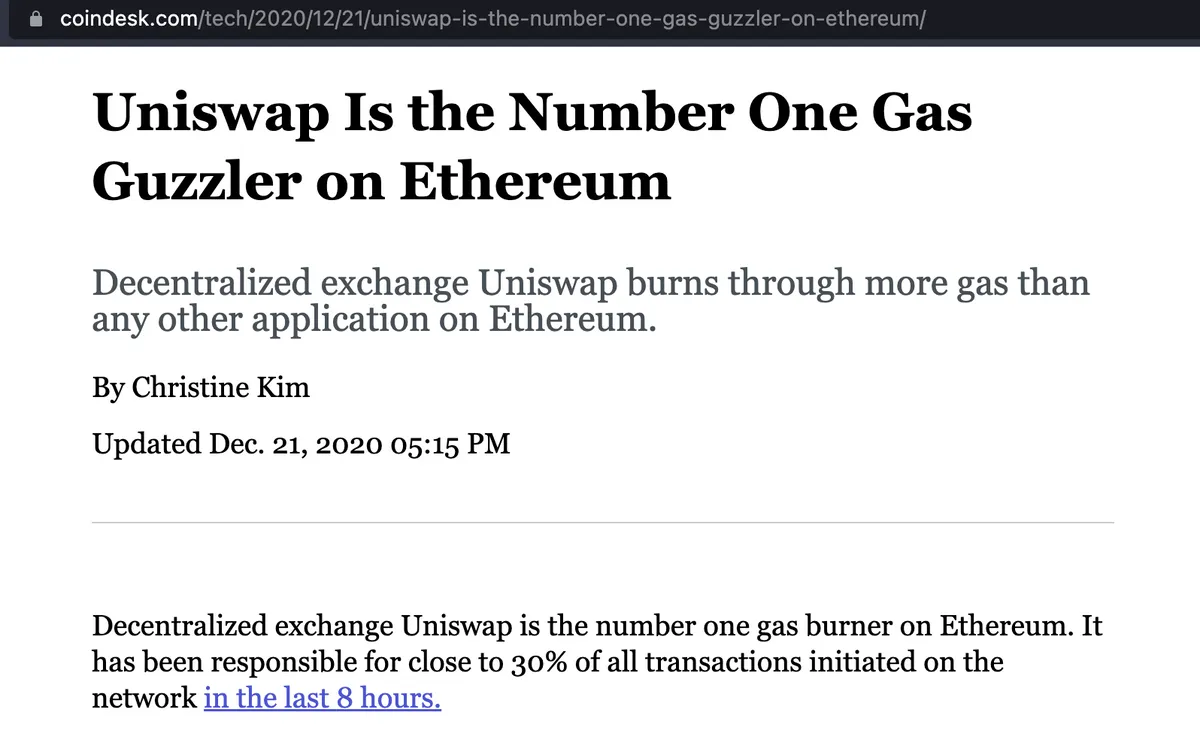
Uniswap is considered to be a transaction-heavy protocol, and its users - responsible for a significant share of Ethereum's transactions (see image from CoinDesk below). As a result, Uniswap users are exposed to Ethereum gas volatility.
^Image source
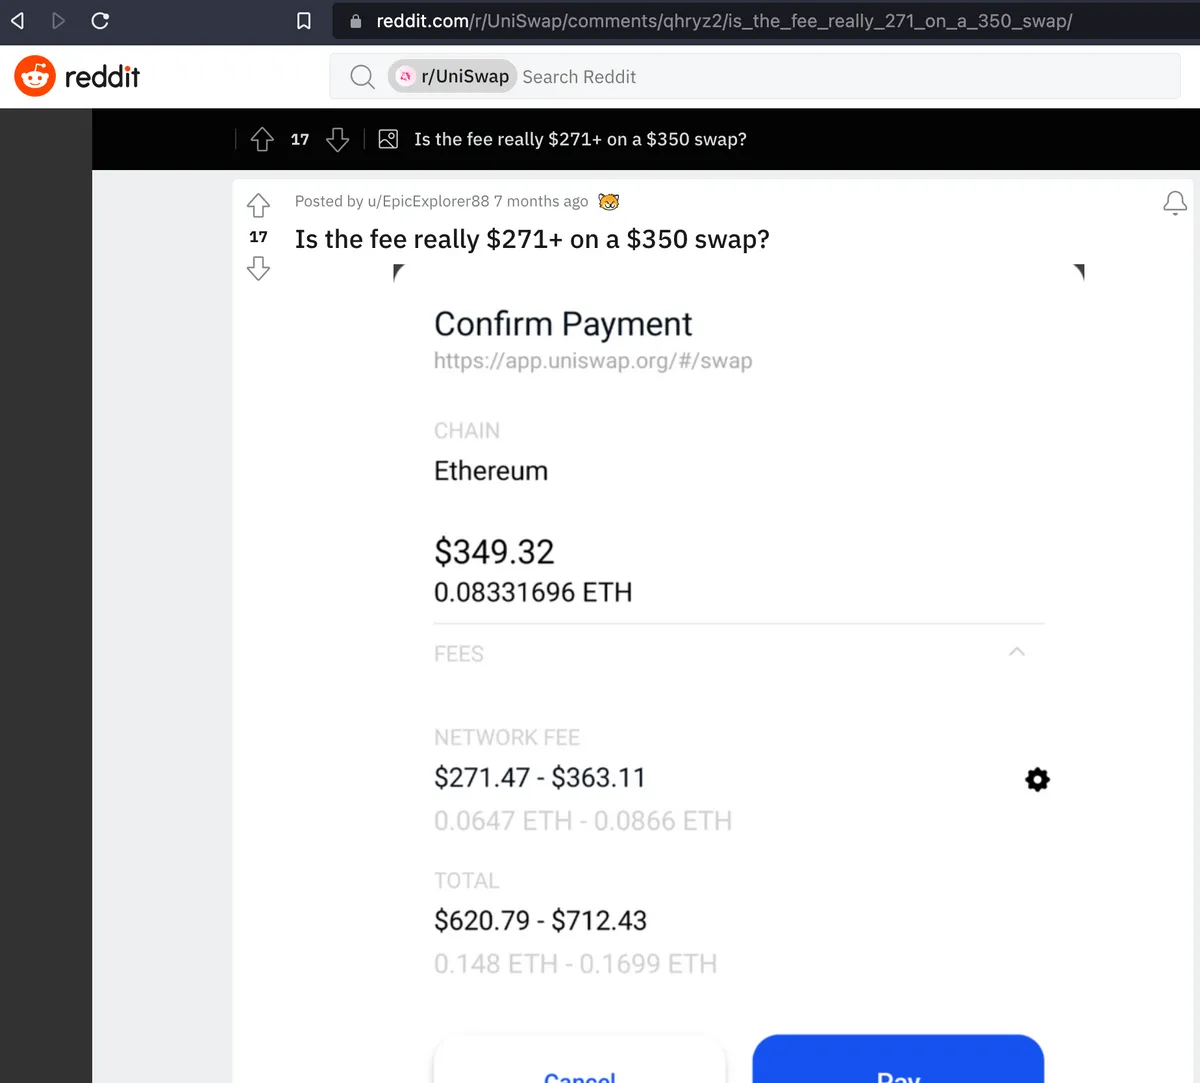
At the time of this writing at the start of June 2022, gas fees have decreased from all-time highs as a result of a bearish, liquidity-drained current state of the crypto market. Yet, in the past two years, network demand and congestion had had Ethereum gas fees per transaction be routinely in the hundreds of dollars (see one trader's example from Reddit below).
The chart below illustrates more clearly that gas has been more volatile than Uniswap swaps on Ethereum:
2. Do gas prices affect some Uniswap users more than others?
The following chart shows swap activity for Uniswap on Ethereum by the size of the swap, from smallest to largest. This visualization uses the logarithmic scale in order to emphasize changes rather than levels.
The chart is interactive. One can double-click the avg_gas_eth in the legend, and then single-click any size group(s) under it, to visualize the volatility of swaps in each group next to the volatility of Ethereum gas: