UST Wealth Inequality
UST is the paramount stablecoin right now, of the Terra ecosystem. As a blockchain promising to bank the bankless in a way different to other EVM based chains, UST forms a vital part of the ecosystem's smooth functioning as it ventures into the realm of strong DeFi expansion. Since most of the activity on Terra is strongly dependant on the performance of UST, the notion of 'Being early is the most productive way in Crypto' , is strongly challenged by this dependance on a stable asset (unless you want the volatility of LUNA).
This asks the question, how centralized is UST ? How equal or inequal is the UST involved in the Terra ecosystem. How BIG the whales are ?
For this analysis, we will use two methods.
- Visualize the disparity using a Lorenz Curve
- Quantize the disparity using Gini Coefficient
Lorenz Curve
Lifting from Wikipedia
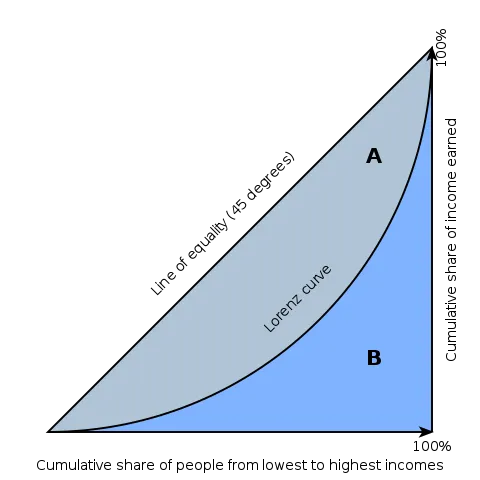
In economics, the Lorenz curve is a graphical representation of the distribution of income or of wealth. It was developed by Max O. Lorenz in 1905 for representing inequality of the wealth distribution.
The curve is a graph showing the proportion of overall income or wealth assumed by the bottom x% of the people, although this is not rigorously true for a finite population (see below). It is often used to represent income distribution, where it shows for the bottom x% of households, what percentage (y%) of the total income they have. The percentage of households is plotted on the x-axis, the percentage of income on the y-axis. It can also be used to show distribution of assets. In such use, many economists consider it to be a measure of social inequality.
In simple terms, the Lorenz curve shows us the disparity in wealth in the form of the curvature of the distribution. In an ideal world (which doesn't exist) the curvature is zero, i.e its a straight line distribution, which means every holds similar wealth. The greater the curvature the greater the disparity.
Gini Coefficient
Again lifting from Wikipedia :
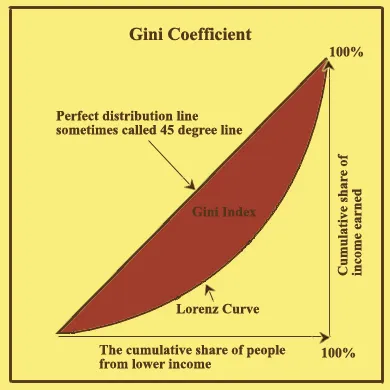
In economics, the Gini coefficient (/ˈdʒiːni/ JEE-nee), also the Gini index and the Gini ratio, is a measure of statistical dispersion intended to represent the income inequality or the wealth inequality within a nation or a social group
The Gini coefficient measures the inequality among values of a frequency distribution (for example, levels of income). A Gini coefficient of zero expresses perfect equality, where all values are the same (e.g. where everyone has the same income). A Gini coefficient of one (or 100%) expresses maximal inequality among values (e.g. for a large number of people where only one person has all the income or consumption and all others have none, the Gini coefficient will be nearly one)
Gini coefficient measure the area between a Lorenz curve and the Line of equality. So in an ideal world we want the Coefficient to be zero. In a Dystopian world like the one in Orwell's 1984, the Gini Coefficient will be 1 (that is, if you are brave enough to collect the data do such an analysis)
Creating Lorenz curve
Creating the Lorenz curve isn't easy, esp on SQL. The idea is to sequence the wealth data, i.e wallets and their associated balances, into wealth buckets (we will use round function to keep the granularity`). These wealth buckets are then arranged in ascending order and cumulative sum is found for each wealth bucket. The cumulative sum will give us the Distribution with respect to each wealth bucket, but that would mean alot of data points, hence we will use percentage of addresses in a wealth bucket, and then rounding it again will give us 100 data points at max.
Calculating Gini Coefficient
To calculate Gini Coefficient on SQL, we will use this blog post by Evgeny Medvedev.
The method is based on the 1 — 2B formula from this Wikipedia page, where B is the area under the Lorenz curve.
While it is easy to use terra.daily_balances to gather wallet balances and perform the analysis on top of this data, we know that most users are probabaly involved in farming of somekind, and hence wallet balances aren't a honest description.
Hence we will use Visualization for two protocols :
- Anchor Earn Deposits
- Apollo Farm Deposits
The deposits into Anchor can be tracked by filtering terra.msgs for deposits into the Anchor Market Contract - terra1sepfj7s0aeg5967uxnfk4thzlerrsktkpelm5s. The redeems can also be tracked as deposits into an user account from Anchor Market. So what does the Analysis say ?
A value of 0.95 Gini Coefficient suggest strong UST concentration of wealth. The scatter chart shows that 1% of Users hoard almost 57% of all Anchor Deposits. Moreover 92% of all UST deposited in Anchor come from only 10% of wallets. 10% of wallets that interact with Anchor.
However, we might want to take this result with a pinch of salt. Alot of Protocols on Terra leverage Anchor vaults to make things happen. Hence, it could be these addresses that are creating the strong inequality.
Apollo DAO, in order to bootstrap its liquidity and to distribute APOLLO tokens, decided to organize a LP redirect method, where UST can be zapped into LP tokens and the yield was redirected into Apollo Warchest. Lets see how was these deposits by users.
Note: We will only consider UST zap ins, cause the LP valuation calculation isn't something I'm good at.
Marked improvement when compared to Anchor. 0.89 is alteast more far from dystopian. Moreover, the gradual change from Pink to Green, rather than the abrupt change in Anchor, suggests a more distributed wealth compared to that of Anchor.
That doesn't stop from 1% of wallets providing 45% of all UST zap ins and 85% of all UST zapped in coming from 10% of wallets.
Terraswap is another vital part of Terra Ecosystem, with every token requiring its own UST Pool to facilitate swapping. Depositing UST into these pairs could be also used to measure the wealth disparity.
Once agin significant Wealth Disparity. However, this is more likely as only big players involve themselves in LP-ing mainly due to Impermanent Loss concerns of the smaller fishes.
Back to Dystopian levels, 1% of wallets have deposited a staggering 79% of all UST provided as LP Liquidity. 97% of all UST provided comes from only 10% of Terraswap interactors. Almost 99% of liquidity is provided by 20% of wallets.
Wealth concentration exists. Like it or Not. Probably a feature of any crypto I guess. Can this concentration be removed ? Isn't the price action of an asset extremely dependant on the vibe of these Whales ?
Either way, Terra does the few crucial things right. 20% APY on savings and exposure to synthetic asset. All with no entry barrier and free from the Influence of governments, is all a normal user asks for. A level playing field for the end user, and Terra provides it, free from interference.
Banking the Unbanked, HELL YEAH