Seasons in the City
Introduction
NEAR Protocol is a decentralized platform that seeks to facilitate the development and deployment of dApps on its blockchain technology. More precisely, NEAR Protocol is a decentralized smart contract platform that focuses on creating a developer and user-friendly experience. Its consensus mechanism is Proof-of-Stake and it uses sharding technology to achieve speed and scalability. NEAR also provides a bridge and scaling solution for the Ethereum blockchain.
NEAR Protocol uses Proof-of-Stake (PoS) consensus to secure and validate transactions on the blockchain. Validators earn NEAR Token rewards for producing new blocks in the form of a static inflation rate of about 4.5% each year.
Token holders not interested in being a Validator can stake to a Validator’s staking pool and earn a portion of Token rewards too. This incentivizes Token holders to stay involved with the community and support Validators who are keeping the network running smoothly.
Methodology
in this dashboard we will analyze Satking transactions on Near protocol
i use flipside data for analyze this dashboard
i this table near.core.fact_actions_events_function_call
and this query for amount sum(tx:actions[0]:FunctionCall:deposit/pow(10,24))
subject in this dashboard
- analysis staking transactions deeply
- analysis distribtions of staking and stakers
- analysis top validators deeply

Observations
According the above charts we can see weekly near Stakes and unstakes also total stakers in last 90 days ago
in 3 Aug 2022 we had the most stakers with 25 users
and in 6 Aug 2022 we had the most Volume of near stakes with 767K $Near
as you can see count of staking transactions more than unstaking transactions in last 90 days ago
Observations
According the above charts we can see distribtion of staking and unstaking actions
deposit_and_stake had the most percentage among all actions with 61.9% and 1027 transactions
and unstake had the most percentage among all after deposit_and_stake
with 22% and mostly 100 transactions
also we can see on the left chart top Near staked based on Volume of staked
this two address thisismine89.near,
brainstem.near
had the most Volume of near stakes
Observations
according the above data we can see distribtion of stakers by count of stakes and Volume of stakes
as you can see on the above charts 61.8% of stakers had just once stake and 31.8% of stakers had between 2 and 5 stakes
the lawest of stakers distribtion, stakes count related between 10 and 20 stakes
also we can see 58.7% of stakers had the more than 2000 $Near staked
and 20% of stakers had between 10 and 20 %Near stakes
the lawest of stakers distribtion of Near staking related to 1000 and 2000 Near stakes
Observations
According the above data we can see top validators based on Volume of staked and Count pof stakers
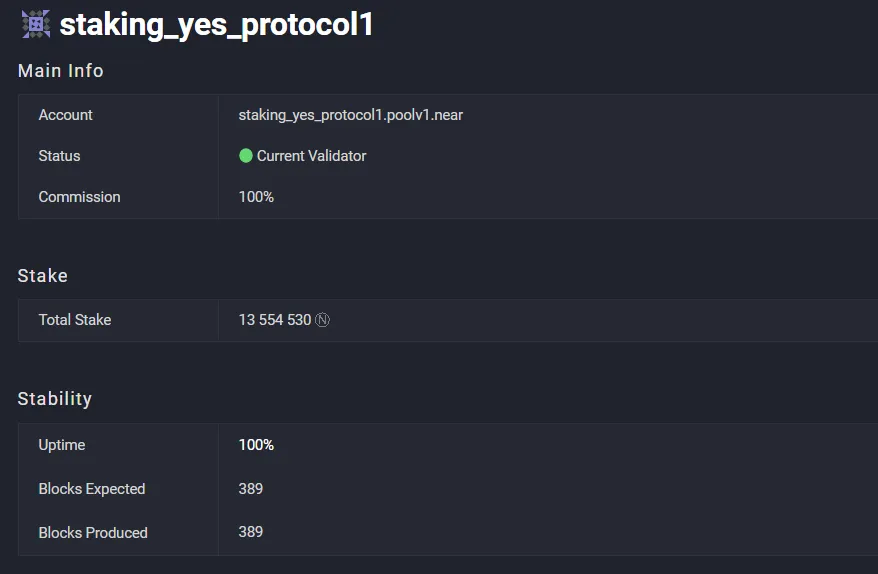
as you can see we had two yes_protocol with Volume of each one 13.5M $Near
staking_yes_protocol1.poolv1.near just had 7 stakers
interesting to know thar yes_protocol1.poolv1.near just had 8 Satkers
after they, bisontrails.poolv1.near with 5.76M $Near
also we can see top validators with count of stakers
the astro-stakers.poolv1.near had the most stakers with 1.7K stakers
and zavodil.poolv1.near had the most stakers after astro-stakers.poolv1.near with K
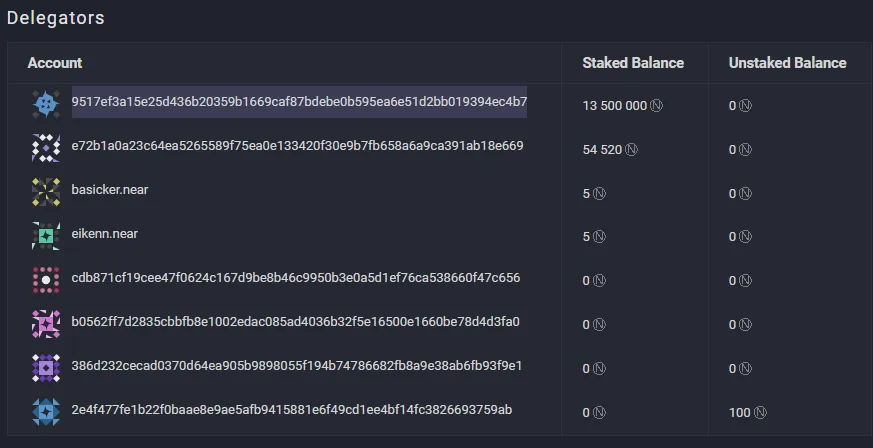
this address 9517ef3a15e25d436b20359b1669caf87bdebe0b595ea6e51d2bb019394ec4b7
staked 13.5M $Near