Bridger Destinations (redux)
Key Findings
- Bridge Volume
- The All Time High (ATH) in volume bridged happened on August 5th, mainly due to the bridging of 80.84M USDC.
- Despite the average bridge size being 95.5k USD over the past 6 months, this is heavily impacted by the biggest bridge whales.
- The most common bridger profile has a bridge size that ranges between 0 and 1k USD.
- There is a large variety of tokens that can be bridged from Ethereum to Optimism. However, the token that has attracted more bridge liquidity is USDC with 728.78M USD. USDT follows second, but it has close to 5.5 times less volume.
- Bridge Transactions and Bridgers
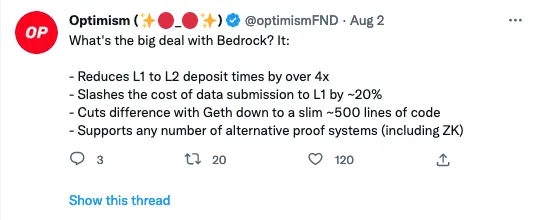
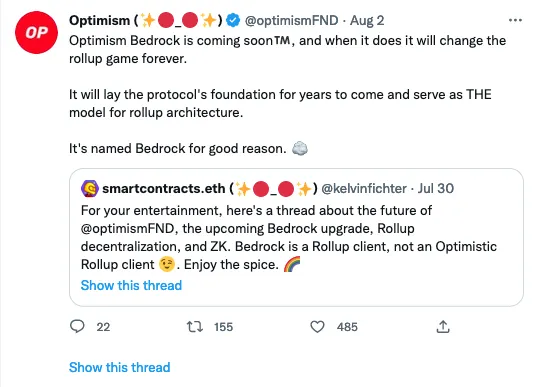
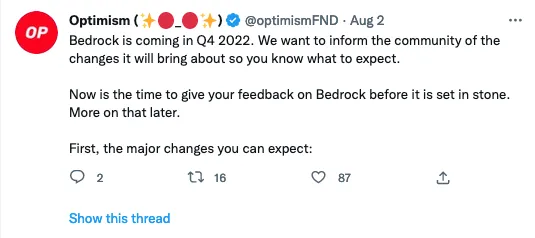
- The number of bridge transactions and wallets increased largely at the beginning of August. This was because the Bedrock upgrade was announced. This will impact the chain positively as it mainly aims to reduce deposit times by over 4x and reduce the cost of data submission to L1 by ~20%. However, as this upgrade is expected to come on Q4 2022 and there have not been any big news regarding this recently, the hype has gone down during the past months.
- Every user has performed on average 1.74 bridge transactions.
- The token that has been bridged the most is USDC.
- The correlation of bridgers among the top 10 wallets by ETH bridged and number of bridges, shows that only 1 wallet is in both rankings. This means that the biggest bridge whales are not those users that use the bridge the most.
- Where do users go when they bridge to Optimism from Ethereum: First Day
- The most common destination over the first bridging day is Hop Protocol. Uniswap, Synthetix and Perpetual Protocol follow as the other top destinations after bridging.
- The daily events and destinations charts show some volatility in the number of transactions over the past months, with high spikes mainly forming at 3/4 day intervals.
- The most common events for wallets that bridged from Ethereum to Optimism are
Transfer,ApprovalandSwap. - We confirm that the clear majority of users go to Hop after bridging, as the most common activity type is
Layer 2. Moreover, we know these are token transfers as the contract used in 89% of the transactions is thetokencontract type.
- Where do users go when they bridge to Optimism from Ethereum: First Transaction
-
The most common destination on the first transaction after bridging an asset is also Hop Protocol. However, compared to the destinations during the bridging day, in this case Uniswap is more popular than Velodrome Finance and Aave is more popular than Perpetual Protocol.
-
Transferis the most common event in both cases.
-
What is a Bridge?
As the number of blockchain networks, protocols, and utilities grow, it is also increasingly necessary to be able to move assets between different networks. However, since each blockchain is independent from the others, and many have their own language, this interaction is not given in such a simple way. For a while, exchanges were used to solve this problem, but that method involved paying various fees, going through many steps, and using centralized services. That is why bridges appeared, which are literally crypto tools that work as "bridges" that connect one network to another, to communicate them and thus be able to transfer information and assets between them.
Overview
This dashboard analyzes the activity of users that have bridged from Ethereum to Optimism. Moreover, this comparison can be observed for three timespans (daily, weekly and monthly - daily by default) as well as for three different time ranges (last six, three and one months - last six months by default). These can be adjusted using the temporality and months_back_from_current_date parameters above. In order to evaluate if different time conditions affect the user activity, the data is compared based on two scenarios:
- Activity during the day of the bridge transaction
- Activity on the first transaction after bridging
Bridge Volume
\
-
The All-Time High (ATH) in volume bridged happened on August 5th, mainly due to the bridging of 80.84M USDC. Moreover, the wallet that bridged the largest amount of funds over time was
0x997fd5f16c9717007244e15e1e47db5f37bd53c2and it did it on that day within 4 transactions (total of 61.48M USDC).\
-
Despite this, that wallet was not the the user that bridged the most funds in one transaction. That was
0x4b3f1048c55faa0c0873e249e541139360501f2a, with 50M USDC. This is actually the second biggest wallet by bridged amount over time. Surprisingly, both of the aforementioned wallets only bridged on one day (they are not recurrent bridgers).\
-
Despite the average bridge size being 95.5k USD over the past 6 months, as seen above this is heavily impacted by the biggest bridge whales. The most common bridger profile has a bridge size that ranges between 0 and 1k USD.
\
-
There is a large variety of tokens that can be bridged from Ethereum to Optimism. However, the token that has attracted more bridge liquidity is USDC with 728.78M USD. USDT follows second, but it has close to 5.5 times less volume.
\
-
The median amount bridged is 3.43k USD. However, once above the median value, the average bridge size exponentially increases to 190k USD.
\
-
The lowest bridge amount per day on average is 14.63 USD. This is not the regular value, as there are most days are way below this number. However, some days happened to have a low number of transactions and the lowest ones were much higher than this average.
\
Bridge Transactions and Bridgers
\
-
The number of bridge transactions and wallets increased largely at the beginning of August. This was because the Bedrock upgrade was announced. This will impact the chain positively as it mainly aims to reduce deposit times by over 4x and reduce the cost of data submission to L1 by ~20%. However, as this upgrade is expected to come on Q4 2022 and there have not been any big news regarding this recently, the hype has gone down during the past months.
\
-
Every user has performed on average 1.74 bridge transactions.
\
-
The token that has been bridged the most is USDC with 6219 transactions over the past 6 months.
\
-
The correlation of bridgers among the top 10 wallets by ETH bridged and number of bridges, shows that only 1 wallet is in both rankings. This means that the biggest bridge whales are not those users that use the bridge the most.
Where do users go when they bridge to Optimism from Ethereum: First Transaction
Where do users go when they bridge to Optimism from Ethereum: First Day
-
The most common destination on the first transaction after bridging an asset is Hop Protocol. However, compared to the destinations during the bridging day, in this case Uniswap is more popular than Velodrome Finance and Aave is more popular than Perpetual Protocol.
\
-
Transferis the most common event in both cases. -
The most common activity type is also
Layer 2, with even a largest share than in the other scenario (56.4% compared to 45.7%). Thetokencontract type is also more common on the first transaction after bridging.
Conclusions
- Bridge Volume
- The All Time High (ATH) in volume bridged happened on August 5th, mainly due to the bridging of 80.84M USDC.
- Despite the average bridge size being 95.5k USD over the past 6 months, this is heavily impacted by the biggest bridge whales.
- The most common bridger profile has a bridge size that ranges between 0 and 1k USD.
- There is a large variety of tokens that can be bridged from Ethereum to Optimism. However, the token that has attracted more bridge liquidity is USDC with 728.78M USD. USDT follows second, but it has close to 5.5 times less volume.
- Bridge Transactions and Bridgers
- The number of bridge transactions and wallets increased largely at the beginning of August. This was because the Bedrock upgrade was announced. This will impact the chain positively as it mainly aims to reduce deposit times by over 4x and reduce the cost of data submission to L1 by ~20%. However, as this upgrade is expected to come on Q4 2022 and there have not been any big news regarding this recently, the hype has gone down during the past months.
- Every user has performed on average 1.74 bridge transactions.
- The token that has been bridged the most is USDC.
- The correlation of bridgers among the top 10 wallets by ETH bridged and number of bridges, shows that only 1 wallet is in both rankings. This means that the biggest bridge whales are not those users that use the bridge the most.
- Where do users go when they bridge to Optimism from Ethereum: First Day
- The most common destination over the first bridging day is Hop Protocol. Uniswap, Synthetix and Perpetual Protocol follow as the other top destinations after bridging.
- The daily events and destinations charts show some volatility in the number of transactions over the past months, with high spikes mainly forming at 3/4 day intervals.
- The most common events for wallets that bridged from Ethereum to Optimism are
Transfer,ApprovalandSwap. - We confirm that the clear majority of users go to Hop after bridging, as the most common activity type is
Layer 2. Moreover, we know these are token transfers as the contract used in 89% of the transactions is thetokencontract type.
- Where do users go when they bridge to Optimism from Ethereum: First Transaction
-
The most common destination on the first transaction after bridging an asset is also Hop Protocol. However, compared to the destinations during the bridging day, in this case Uniswap is more popular than Velodrome Finance and Aave is more popular than Perpetual Protocol.
-
Transferis the most common event in both cases.
-
Methodology
The data used in this analysis was collected by combining the information on the ez_token_transfers, fact_event_logs and dim_labels tables of the core schema of the Ethereum and Optimism databases.
- The first table provided information about the bridge: volume, transactions, users and tokens transferred.
- The other two tables were required to display the most common events, destinations, activities and contract types of the wallets that bridged from Ethereum to Optimism.
Optimism Gateway Contract: 0x99c9fc46f92e8a1c0dec1b1747d010903e884be1
Terms Used that Require a Definition
- Whale: individuals or entities that hold large amounts of crypto-related assets.
- All-Time High: it is the highest price ever reached by a cryptocurrency. However, it can also be contextualized within a time range period.
- Median: it provides a helpful measure of the centre of a datase. In the context of this dashboard, it means that there are as many bridge transactions both above and below this value.
-
The most common destination over the first bridging day is Hop Protocol, by a large majority. Hop Protocol is a cross-chain bridge that aims to facilitate fast token transfers between different Layer 2 scaling solutions for Ethereum.
\
-
Uniswap, Synthetix and Perpetual Protocol follow as the other top destinations after bridging.
\
-
The daily events and destinations charts show some volatility in the number of transactions over the past months, with high spikes mainly forming at 3/4 day intervals.
\
-
The most common events for wallets that bridged from Ethereum to Optimism are
Transfer,ApprovalandSwap.\
-
We confirm that the clear majority of users go to Hop after bridging, as the most common activity type is
Layer 2. Moreover, we know these are token transfers as the contract used in 89% of the transactions is thetokencontract type.
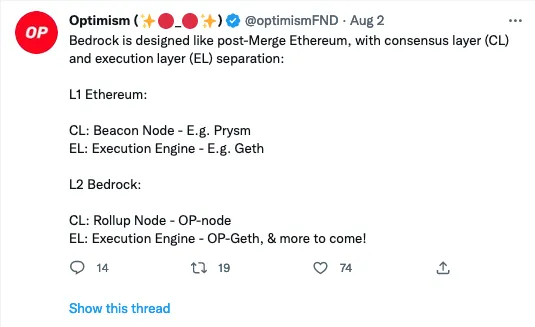
Social Media on the Bedrock Upgrade