NFT Comparison
Compare and contrast the NFT market and ecosystem across at least three different chains (you can do more if you wish, but there must be at least three included.) Explain how the various chains differ in terms of metrics.
What is an NFT?
Non-Fungible Tokens (NFTs) are ownership certificates stored on a blockchain and backed by blockchain technology (e.g. Ethereum) that are often associated with a digital asset such as visual arts, videos, music or collectibles. Unlike fiat money or cryptocurrencies, which can be easily replaced and substitutable, each NFT is unique or “non-fungible” and cannot be deleted or counterfeited.
Overview
This dashboard compares different NFT metrics of the current market across four different chains: Ethereum, Solana, Flow and Optimism during 2022.
Key Findings
- Ethereum and Solana are the two leading chains by NFT sales volume and sale price/day. However, the volume of Ethereum only held strong until May 11th.
- Despite the volume being higher on Flow than on Optimism, the average sale price/day is actually higher on Optimism.
- There is not a huge gap between the number of sales between Ethereum and Solana. This is because the NFT space in Solana appeared as a solution to the high transaction fees on Ethereum. Thus, many projects decided to launch on Solana to target users with a smaller budget, that could not afford to spend a large amount of their funds on fees.
- Even though most sales in Flow came from the moments sold in the sports collections, these are very diversified across many unique buyers.
- Despite Flow having almost 100 times more sales per day on average than Optimism, most of these came from the Top Shot and All Day collections. Thus, the number of collections sold in both chains was very similar.
- Optimism is the chain with the highest average minimum sales, because it was not until May that many NFTs got sold, and those that did, happened to be at a high price.
- The most expensive NFT among the 4 chains was sold on Ethereum for 50.6M USD, and it belonged to the Meebits collection.
\
-
Ethereum and Solana are the two leading chains by NFT sales volume and sale price/day. However, the volume of Ethereum only held strong until May 11th. This was because that was one of the craziest weeks in crypto history, due to the collapse of the UST stablecoin and Terra's LUNA governance token. LUNA, previously a top 10 coin by market cap, fell 99.9999% at a fraction of a cent, and UST, designed to hold at $1, went down to less than a cent in a matter of days. This situation created a lot of panic in the crypto market and most cryptocurrencies crashed around a 30%-60%. Since then, there has been a lot of fear in the market (especially for wallets with large amounts of funds). Thus, many people sold their NFTs as soon as they saw what was coming (May 9th) while many others decided to wait for the market to turn bullish again to sell their NFTs in profits.
\
-
Flow’s volume was not very impacted during May mainly because of the NBA Topshot collection. The NBA playoffs started on Saturday, April 16 and ended on May 16th. The conference NBA finals between the Boston Celtics, Dallas Mavericks, Miami Heat and the Golden State Warriors started on May 17th and lasted until May 29th. This event created hype on the collection, keeping the NFT volume similar to the one before the event.
\
-
Despite the volume being higher on Flow than on Optimism, the average sale price/day is actually higher on Optimism, mainly due to having less sales and some inmense spikes of volume during the last days of April and the first week of June.
\
-
There is not a huge gap between the number of sales between Ethereum and Solana. This is because the NFT space in Solana appeared as a solution to the high transaction fees on Ethereum. Thus, many projects decided to launch on Solana to target users with a smaller budget, that could not afford to spend a large amount of their funds on fees.
\
-
The number of sales on Ethereum during May 11th and 12th was much lower than any other day of the year due to the UST/LUNA crash. Optimism being an Ethereum L2 chain, it was also affected heavily during that week in the number of sales.
\
-
There was also a big market crash on June 13th, where ETH’s price went from 1.8k USD to 1k USD in a matter of days.
\
-
Solana was not heavily affected by these crashes as it recovered from them in a matter of days. Moreover, the number of sales on Solana have been increasing consistently during 2022.
\
-
After the playoffs ended, the NBA Top Shot collection lost momentum, which translated to a small decrease in sales. It went up to around 25k sales/day at the end of the summer, mainly due to the start of the NFL season and the impact this has had on the All Day collection.
\
-
The number of sales on Flow is much higher than Optimism’s, as the latter started to catch some volume on May and it has a higher sales price. Besides this, Flow’s sales come from their two main collections (NBA Top Shot and NFL All Day), which are constantly releasing new moments at a very cheap price.
-
Despite the number of sales being similar between Ethereum and Solana, the number of buyers of the first is twice the size of the second’s.
-
The number of buyers on Ethereum and Optimism follow a very similar trend compared to the number of sales on these chains.
\
-
Flow has oscilated around 5k unique buyers troughout the year, with some peaks correlated to the daily volume.
\
-
Even though most sales in Flow came from the moments sold in the sports collections, these are very diversified across many unique buyers.
\
-
Ethereum has sold 8 times more collections than Solana, but the first has seen some progressive slow decrease of these since the beginning of the year. Even though Ethereum has many already established collections, not many of them have been able to keep up with the expectations of the previous bull run.
\
-
On the other hand, Solana’s collections sold have been steady across the year. Most of them happened on Magic Eden (v1 before January 23rd and v2 after this date). Solanart has been decreasing in the number of collections sold since the beginning of the year.
\
-
Despite Flow having almost 100 times more sales per day on average than Optimism, most of these came from the Top Shot and All Day collections. Thus, the number of collections sold in both chains was very similar.
\
-
However, there is a difference between the two in terms of when were they sold. The collections in Flow were sold evenly across the year, while Optimism sold most of them between May and August.
-
Most NFTs on Ethereum were sold in OpenSea, followed by x2y2 and LooksRare.
\
-
All NFTs sold on Optimism were sold in Quixotic, the largest NFT marketplace on Optimism.
\
-
The majority of NFT sales on Flow happen in the Top Shot Market, as there are new NFTs being released often at very low prices.
\
-
The fact that Flow has very low fees makes it easier for the users to purchase/sell their NFTs.
-
The median provides a helpful measure of the centre of a dataset. This means that there are as many sale transactions above and below this number. In this case we can see that on average during the past year, the median sale price on Ethereum has been 173 USD.
-
However, the median sale price shows how the UST/LUNA crash afected the different chains, especially Ethereum and Solana. The crash not only lowered the price of $ETH and $SOL, but also the floor price of most NFT collections. The latter is equally characterized by the median, as it went from 173 to 46.7 USD on Ethereum and from 15 to 6.16 USD on Solana after May 11th.
\
-
The median sale price of Flow did not vary much during 2022.
\
-
Despite the lowest sales on each chain being so low, that was a rare scenario, as the average size of the minimum daily sale for each chain is much higher.
\
-
Optimism is the chain with the highest average minimum sales, because it was not until May that many NFTs got sold, and those that did, happened to be at a high price.
\
-
On February 7th, only 10 NFTs were sold to 4 different buyers on Optimism, and they lowest one was sold for 223 USD.
\
-
The most expensive NFT among the 4 chains was sold on Ethereum for 50.6M USD, and it belonged to the Meebits collection. After Februrary, the most expensive NFTs sold were priced much lower than during the previous months.
\
-
On Solana, the most expensive NFT was Degod #270, which got sold for 282k USD. The second most expensive NFT in Solana was sold for half this price. Despite the high price of the latter, there is a huge price difference compared to the most expensive NFT sold on Ethereum.
\
-
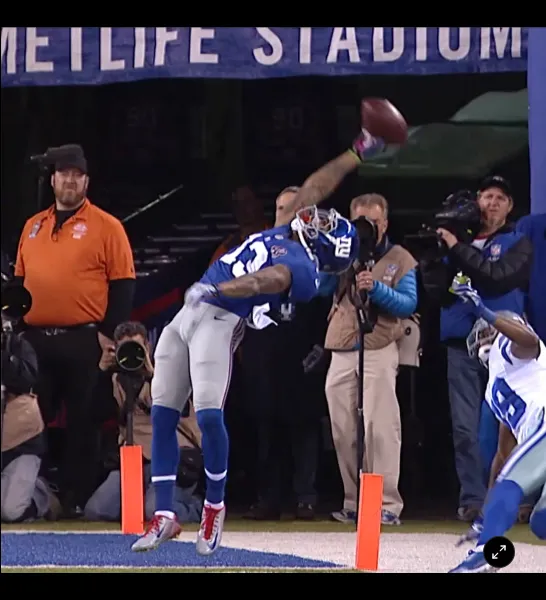
Flow’s most expensive sale was an All Day ultimate moment where Odell Beckham Jr. burst onto the NFL scene with one of the most remarkable catches in modern history as a rookie against Dallas.
\
-
Finally, the Optimism leader in sale price was ‘Killian the Sicilian’ from the Dope Wars Hustlers collection.
Conclusions
- Ethereum and Solana are the two leading chains by NFT sales volume and sale price/day. However, the volume of Ethereum only held strong until May 11th.
- Despite the volume being higher on Flow than on Optimism, the average sale price/day is actually higher on Optimism.
- There is not a huge gap between the number of sales between Ethereum and Solana. This is because the NFT space in Solana appeared as a solution to the high transaction fees on Ethereum. Thus, many projects decided to launch on Solana to target users with a smaller budget, that could not afford to spend a large amount of their funds on fees.
- Even though most sales in Flow came from the moments sold in the sports collections, these are very diversified across many unique buyers.
- Despite Flow having almost 100 times more sales per day on average than Optimism, most of these came from the Top Shot and All Day collections. Thus, the number of collections sold in both chains was very similar.
- Optimism is the chain with the highest average minimum sales, because it was not until May that many NFTs got sold, and those that did, happened to be at a high price.
- The most expensive NFT among the 4 chains was sold on Ethereum for 50.6M USD, and it belonged to the Meebits collection.
Methodology
The data used in this analysis was collected by combining the information on the ez_nft_sales and dim_nft_metadata tables of the core schema of the Ethereum, Solana, Flow and Optimism databases.
- The first table provided information about the NFT sales on each chain, which were analyzed with different metrics such as sales, volume or buyers.
- The second table was joined with the first one to obtain the collections sold on some chains.