Solana - Magic Eden Volume Trends
Create a visualization of Magic Eden total sales volume per day since January 1st. How has sales volume trended over time? Are there any trends to when sales volume seems to go up or down on certain days of the week or during certain times of the day? Are users more likely to trade a NFT during the week or the weekend?
Date: 2022-03-16
This analysis is focused on the volume trends for the NFT Marketplace Magic Eden on Solana.
All data is from January 1st 2022 till March 16th.

What is Magic Eden?
Magic Eden is a NFT Marketplace on the Solana Blockchain. Its concept is to offer an affordable service based on 0% listing fees and very moderate 2% of transaction fees.
What the graph shows:
- We ignore the down spike on February 22nd as mentioned above ...
- The Average Sales Volume is around 58.7 K
- The Sales Volume is constant high and most of the time higher than the Average Sales Volume, expect January 21st/22nd and End of February till mid of March.
- There is also a down spike on January 21st and 22nd in Volume and also in Number of Sales.
Generally the Volume is very volatile, also the Number of Sales but it is a bit more constant. Looking at the sales volume trend over time, we see a downtrend starting at the End of February which lasts.
Weeks are colored in the chart to make it easier to compare. When looking at the chart and searching for trends, no trends are apparent when comparing weeks. A trend on specific weekdays or at the weekend is not visible.
Days are colored in the chart to make it easier to compare. It looks like Tuesdays are having higher Volume than other days. Also Saturdays peeking out very often. Let's check if this is the case.
Thanks for reading!
Conclusion
Which trends have we found:
- We are in an ongoing downtrend in Volume since the End of February.
- Looking at weeks, there is no trend visible.
- Looking at weekdays, we could see a trend to high volume on Mondays, a real trend during the week is not visible.
- Looking at hours we could see a up- and downtrend around 11am & pm.
This analysis was created on 2022–03–12 for a bounty at Flipside Crypto by piper to answer the following questions:
Solana - Magic Eden Volume Trends: Create a visualization of Magic Eden total sales volume per day since January 1st. How has sales volume trended over time? Are there any trends to when sales volume seems to go up or down on certain days of the week or during certain times of the day? Are users more likely to trade a NFT during the week or the weekend?
All data used are from Flipside Crypto.
*Twitter: *
The Next chart shows the daily sales volume over the defined timeframe and compares it with the number of sales per day.
Finding: On February 22nd the number of transactions is nearly 0. I couldn't find any news or information about network problems, so i guess there is a problem with the data in velocity for this day. We'll ignore this behavior from here on!
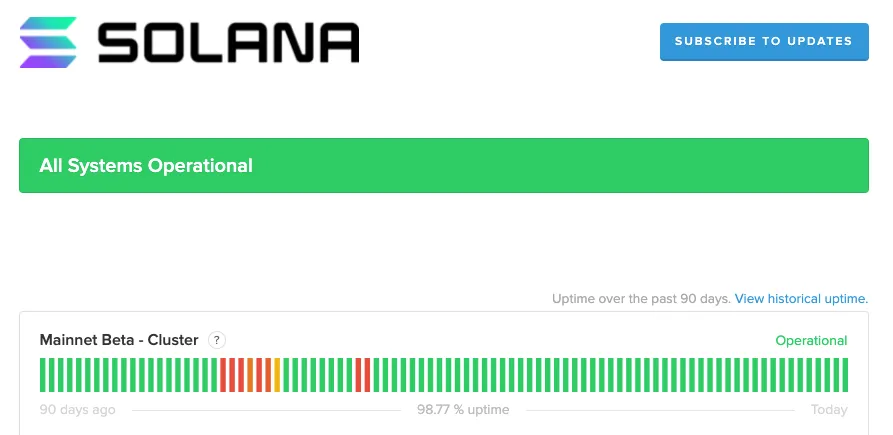
The down spike was caused by a Solana Blockchain problem, as we could see on this screenshot from Solana Status Page.
Source: https://status.solana.com
Grouping the Sales Volume by Weekday shows a bit different result. The highest total volume could be seen on Mondays followed by Saturdays, Thursdays and Tuesdays. These 3 days are very close in numbers. Out findings for Tuesday and Saturday are not wrong, but they are not having the top volume. The lowest volume is on Wednesdays.
Looking at Sales Volume grouped by hour shows that the lowest Volume is at 11am and the highest at 11pm UTC. So the trend here is that the volume around 11 is always go smoothly up and down.