52 Pickup: Is $52 the Luna floor?
Analyzing the impact of the recent billion dollar OTC bitcoin for Luna sale.
Question:
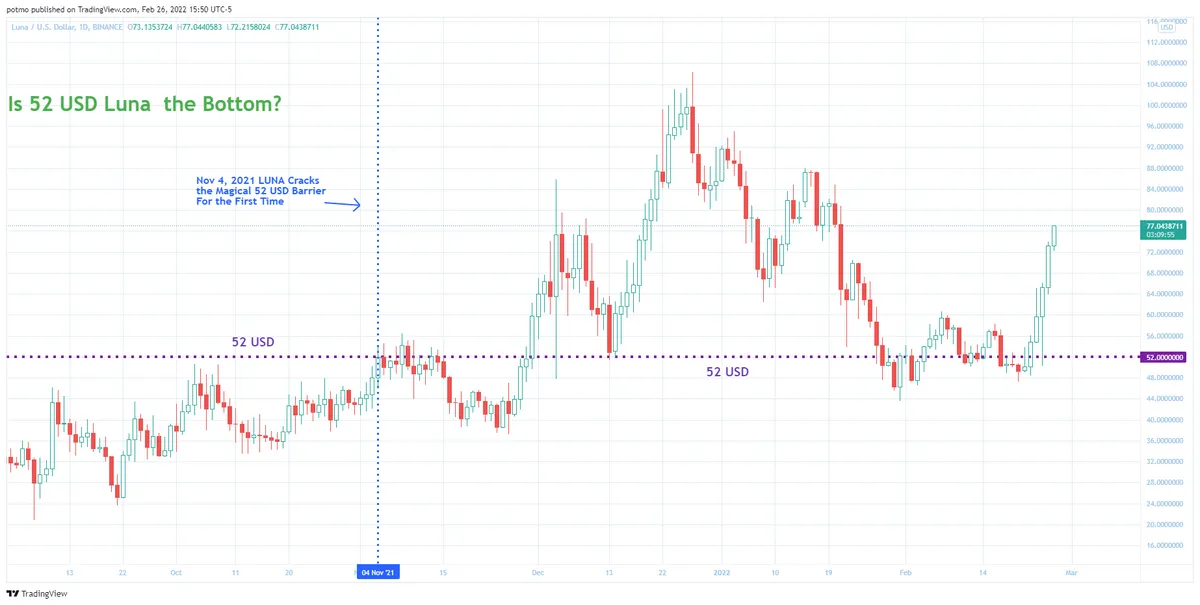
Recently, a deal was announced wherein LUNA was sold for BTC at a price of about $52/LUNA. Some commentators on crypto-Twitter are contending that this represents the new floor price for LUNA.
Over a time period of your choosing, how many days has LUNA closed above this price? How many days has it closed below this price?
Note to reader:
This is a supplemental dashboard of my bounty submission, which can be found here:
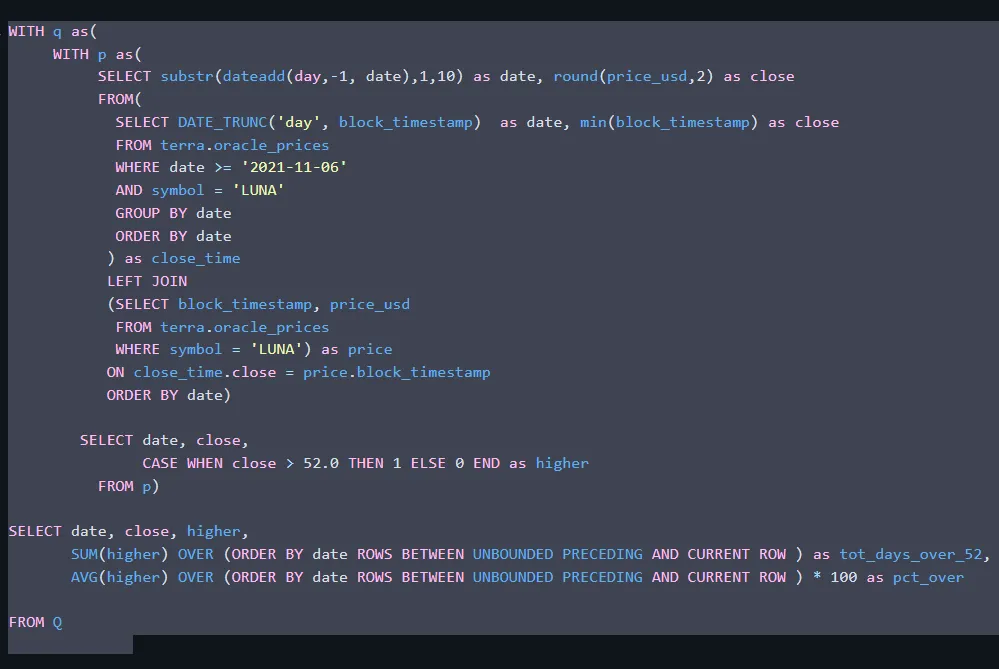
The y axis is the percentage of days over 52. Each bar represents a day and measures the percentage for the period starting November 5 and ending on that date.
The code below produced this graph.
Here is the results table
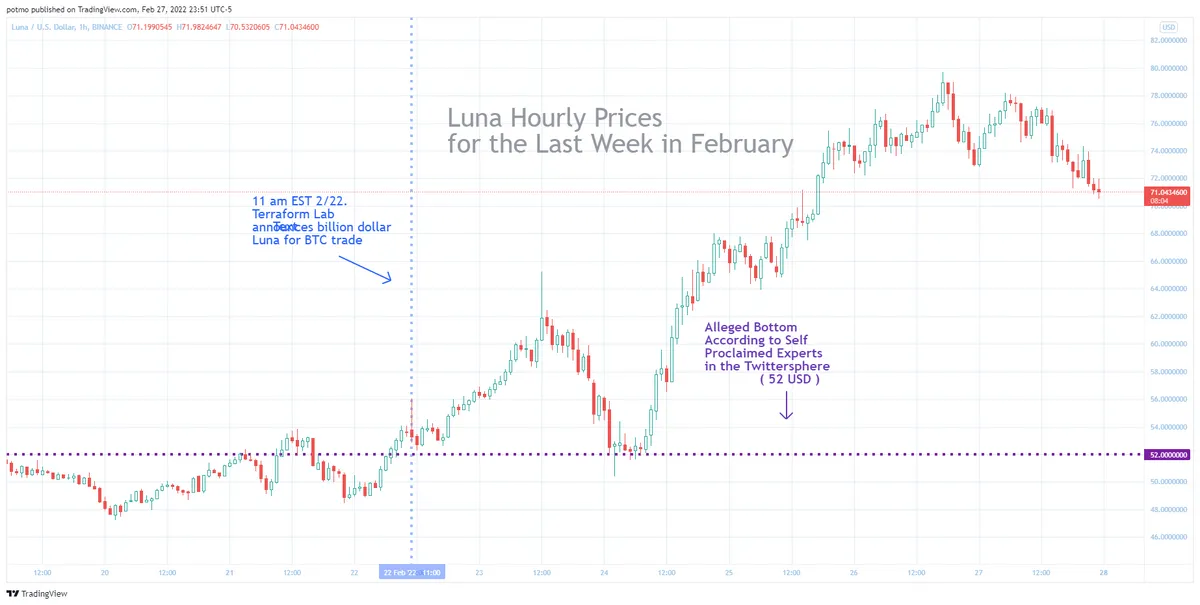
The case for a 52 dollar bottom, when viewing an hourly chart on and around the day where "The Deal" was announced. It certainly appears that after testing a 52 dollar support level, the price shoots up, presumably leaving 52 behind or at least relying upon it to hold up in the future...
But looking at the daily chart below, one sees just how quickly and how much the price can fall.
I inserted the price graph below because it uses the data from Flipside's oracle_prices table in the Terra schema. The values match the trading view chart nicely. Overlaying this with the "main" graph didn't seem to me to produce any particularly interesting insights.