Daily Active Osmosis Users
A horrendous use of the term. But an interesting SQL challenge and a useful idea to segment users.
The Question:
What does a Daily Active User look like on Osmosis?
> For this exercise, consider a DAU would be any wallet transacting on Osmosis a majority of days every week. > > \
- First, plot out how many DAUs there are on Osmosis.
- Once you have the DAUs, what does their activity look like?
- Do they LP more or swap more?
- How often do they transfer tokens into Osmosis?
- Where are these transfers coming from?
Using the literal interpretation of “DAU” we extract the key metrics…
In this report we examine a proposed radical change in the definition of a common metric, used by Web3 analysts, labelled “Daily Active User”, defined as
> any wallet transacting on Osmosis a majority of days every week
There are several problems with this definition:
- the original definition is used as a measure of network activity as opposed to a measure of user activity
- at best, if we decide that we are measuring network activity, we should at the very least rename this term "Weely Active Users".
- Taken literally (and how else am I supposed to take a defined metric? We need precision here!) the metric does a poor job of capturing active users.
As an extreme case, someone who started actively trading from the genesis of the Osmosis blockchain, but took a vacation for one week, is not a "DAU", whereas someone who just created a wallet a week ago and transacted once on 4 of the seven days of the week, makes the list. Not only is filtering on these users an extremely complicated process, it is less meaningful, than more simple techniques.
What I like about the excercise:
- It calls to attention the need for a precise, meaningful and consistent definition of active users.
- It calls to attention the need to think in terms of user segmentation.
- It provides an excellent SQL challenge.
- It gives us an opportunity to explore the new Osmosis tables to determine user behavior. The methods required will, of course, apply to any sets of users, so this excercise is useful to us.
- It pays (hopefully)
My Approach
Using the Osmosis.core.fact_transactions table, I aggregated and then filtered user data.
- First and last weeks were not counted, since the weeks were/ are incomplete.
- Going by the strict definition,
- Only wallets with at least 4 interactions on the last full week were counted
- Wallets must have at least 4 transactions on every week without exception
- I did not expect wallets to have transacted every week on weeks before they started transacting.
- I begin counting from the period of the first transaction, initiated by the user. I label this "activation date". Note that this is not the "creation date", or when the wallet first received funds.
Getting geekql with the SQL.
I had to pace around for hours trying to figure out how to do this. Several cups of coffee and laps around my study later I came up with the following methodology:
Step one: Create a table, grouping by week and user counting distinct days, and getting the first and last week in which the address transacted.
- The Maximum week must equal the last complete week on the table (ending '2022-10-10').
- weeks in which the user did not transact at least 3 times are eliminated.
- The activation date is important to complete the next step.
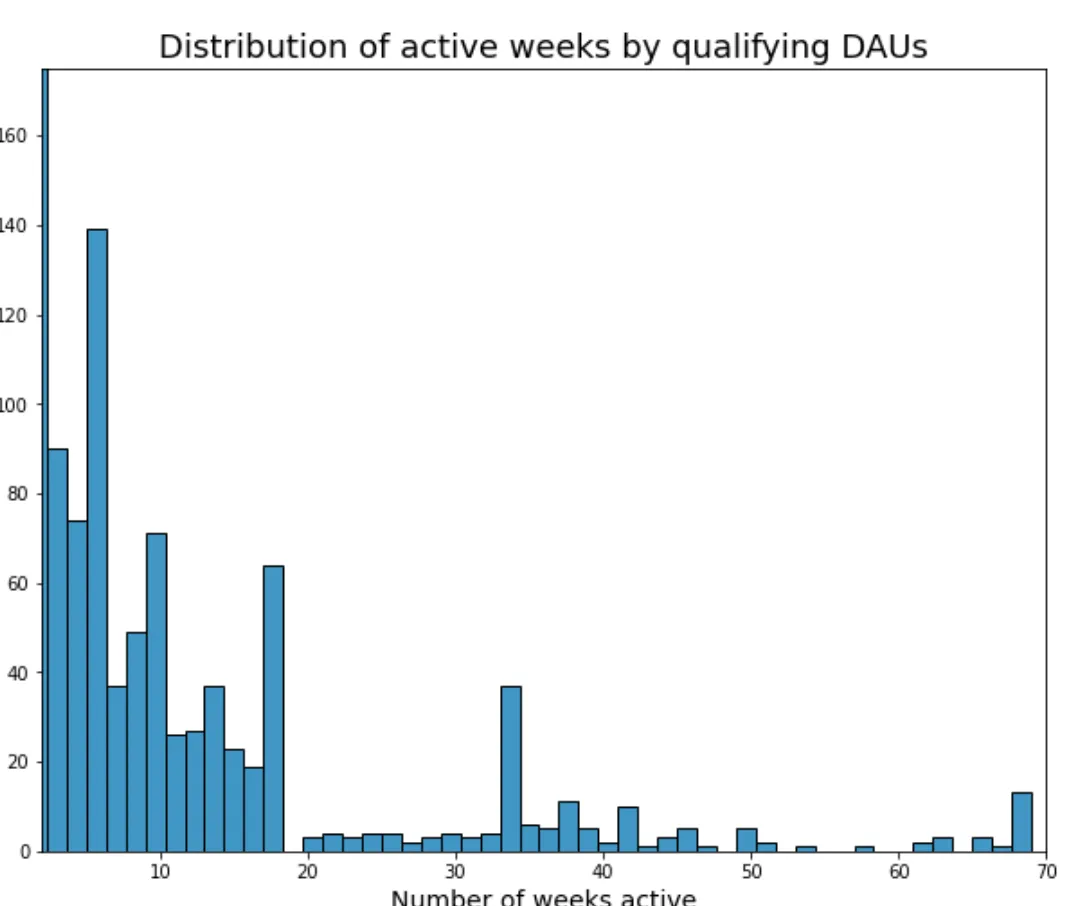
- we will aggregate this new table, by grouping by user and counting weeks. This list, however is too large.
- While only weeks with transactions greater than 3 are tallied, an address which had 0 transactions does not appear, as there was no transaction. We can deduce the number of weeks which are required, for an address to qualify.
Concluding thoughts
When examining metrics and defining new terms, it is important to be precise and to think about the implications of the definitions. This particular term, doesn’t quite work, either as a measurement of the network or as a meaningful user demographic. The biggest insights gleaned were mainly from solving the SQL problem. Assuming that what the questioner had in mind was what I depict on the top graphs, where I simply count the number of distinct users that performed at least four transactions, that particular week. There are some interesting spikes. The overall health of Osmosis looks pretty good, as a tell tale sign of a healthy chain/ protocol is that the new bottoming levels are at a higher level than they were before the bull market.