OlympusDAO - 21. Inverse Bonds Popularity
Individual activity of wallets using Olympus' newly released 'Inverse Bonds'
Question:
Inverse bondsis a new feature that came out with OIP-94 on 26/4. With inverse bonds, users can trade their OHM in exchange for some treasury assets.
-
How many total and daily distinct wallets have used the inverse Bonds feature since it came out?
-
Bonus: What was the average premium per inverse bond transaction?

Introduction
Olympus Background
The Olympus DAO uses OHM as its native token, designed to become a reserve currency. Rather than creating a stable coin backed by fiat or algorithmic, OHM is backed by a diverse basket of crypto assets and protocol owned liquidity. Since the whole point of crypto was to get away from the fiat system.
Users can either stake their OHM or, through a process called "bonding", lock up their assets for a set amount of time in exchange for discounted OHM, with greater incentives for longer lock up time. This innovation is believed to be a big step forward in avoiding the predatory yield farming tactics prevalent today. It is advantageous for protocols to avoid paying enormous, unsustainable yields to attract liquidity, only to watch the stakers jump ship the moment the APY decreases.
With OHM the protocol owns its liquidity and gains are made through discounts instead of via APY.
Inverse Bonds
Inverse bonds are a mechanism, designed to absorb sell pressure for OHM, so as to increase backing and revenue while helping to maintain the price. Instead of bonding assets for OHM, the user sells OHM, usually at a premium. These inverse bonds are limited and only sold when the OHM market price falls below the backing of OHM.
Methodology
The Inverse bond creator contract takes the OHM in. We can see on the ez_token_transfer table in Flipside's new ethereum_core schema, all the information we are interested in. The table below answers the first part of the question; the total unique wallets that bought inverse bonds. As of this writing, there were 104 wallets and 282 total transactions. The table below should give a more recent result as the query is refreshed daily.
Above, we see the number of unique wallets across time, as well as the amounts transacted, depicted both in size and color. There seems to be an initial increase in interest. May 11th and May 12th saw big volumes. This might be a future line of research.
There appears to be a general upward trend in interest. The period of time is too short and many other mitigating factors are in play, notably macro economic conditions and a bear crypto market. so no strong conclusions can be made with any degree of confidence at this time.
Remembering that these inverse bonds are only sold when the market corrections dictate, and that their distribution is limited, so tracking counts and volumes can only get us so far. The average wallet participating in these transactions could be categorized as serious investers, but, at least based on the size of these transactions, not necessarily be considered "whales", as in an entity that can effect the price with the size of their purchases and sales.
To do this, we divide the total dollars spent by the total OHM sold back to the treasury and compare this with the average price of OHM during this period.
This is why you have to be careful when you aggregate stuff. Aren't inverse bonds supposed to be a deal? Hard to think why one might eagerly sell their OHM off at half the market price! Either I am getting my directions backwards and am misunderstanding what is going on with this... but I think I understand. We are going to have to chart this but here is what I am thinking: They are sending 16 bucks worth of OHM and getting 35.40 bucks of DAI back???
So here is what we do now. We take a look at a transaction where the contract is sending DAI back and our mystery may be solved...
I take to Etherscan and examine this sample transaction. I see the wallet spent $892 to get $889 of DAO.
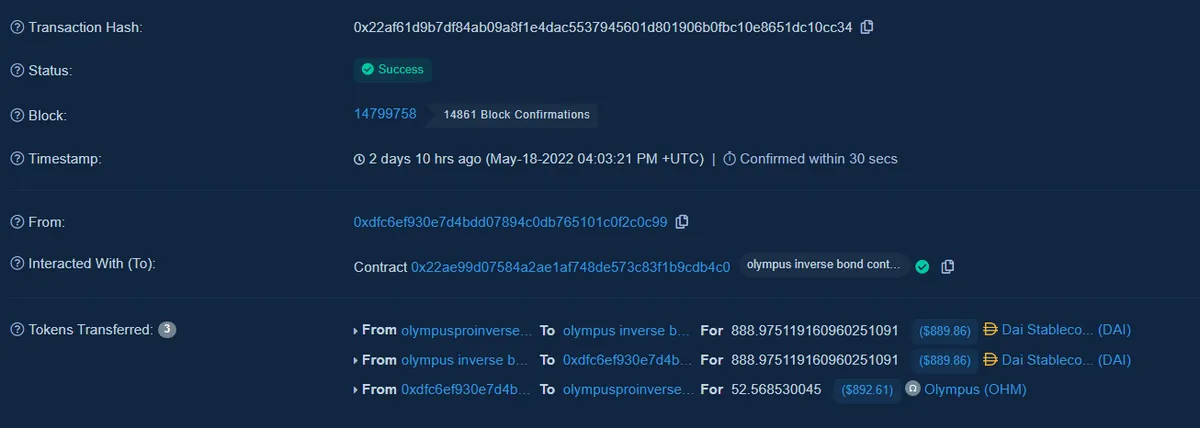
So we see that the price of OHM on this transaction was $16.98 and the price according to the Flipside ethereum_core. Querying the flipside_prod_db.ethereum_core.fact_hourly_token_prices table for the OHM price on May 18 at 4 am was
So, unless I am missing something, it looks like this particular transaction didn't work out. While querying here though I discovered the problem with the mysteriously bloated earlier average! The old V1 vs V2 rears its ugly head! It's oh so easy to overlook stuff like this!
Yep, that's right. The price of OHM was both $49.34 AND $17.17. The current iteration of OHM is V2. People with OHM V1 can still switch over, but the inverse bonds and the rewards action is all happening with the V2 token. So... double check your queries! Make sure you are getting all of what you want and none of what you don't want!
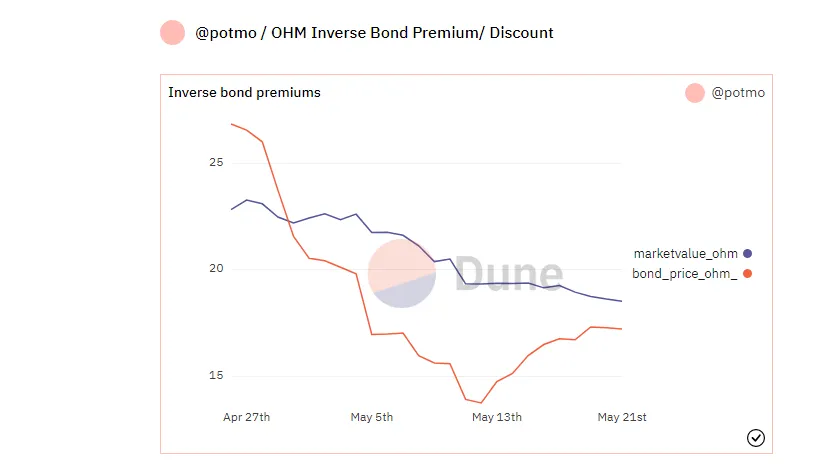
So while closer, I was still expecting this to be the other way around. But we have to break this down further, instead of relying on one large number, as people can time their purchases only at certain times when there is a large fluctuation. So time for some more eye candy!
Pay no attention to that downward price action. We just want to see if inverse bond purchasers are Well, obviously it would be nice here to put the time series of token. We can add aggregated hourly data (time permitting) but let's zoom in first and look at a scatter plot of each transaction, and what the price was at that time. We can have a larger bubble based on the size of the transaction!
Times Up!
Well, I was feeling pretty good about this for a while, and then I realized when i merged the columns that, in fact, I was not measuring the price including the premium, and that this table was only doing the same thing I was for the price! Have I mentioned that this is a beginner's bounty?
So, we can't compare the market price with the market price... we need the actual exchange rate paid by the treasury! A careful perusal of the contract and its inner transactions is needed. Some magical decoding, offsets reencoding etc. and you too can have this information. How do you do it? I am told that if you pull up the contracts and dig around, that all answers are easily right in front of you, but this is still a struggle for me.
I find the answer!
Digging around on the Olympus Discord server, I am able to ascertain, that the kind, geeky folks at Dune have community provided tables, which have already broken down the data. Even more encouraging, is the fact that the Olympus DAO bond team has, what would have been way too complex of an answer for me! We go, instead of using the contracts innards, with the formula used to compute the discounted(?) price. Figuring out the circulating supply of gOHM and OHM and using a 120 moving average are part of the formula.
Not wishing to reinvent the wheel, I ahem borrowed their query . Thanks to @olympusdao_bonds_team
Here is the link to my dune dashboard
Summing up:
We dove into a rather complicated but, in my view a very significant topic — the inverse bond. It has acted as a mechanism to soak up irrational selling behavior. We can see from the large volume of purchases on the dates where the premium/ discount is largest, that the mechanism seems to be adding a nice weapon to the OlympusDAO arsenal.
I like to sometimes include some of the pitfalls, trials and tribulations that I tend to go through with these things, rather than come off as a PR firm for a protocol or to otherwise pretend that my audience is different from what it is. I hope my honet asessment of my shortcomings will not be judged harshly! I hope you enjoyed this and thanks for reading!