Whats going on with Gnosis?
This dashboard here gives a piece of broad information about the recent activity in Gnosis by mainly focusing on the users, the transactions, the volume, and the volume compared with the same in the previous months.
INTRODUCTION
Built on the Ethereum blockchain, Gnosis is an open-source, decentralized prediction market. Users have the ability to set up marketplaces where they may make predictions about any event or arbitrary result. Gnosis can provide a safe and open ecosystem by utilizing the Ethereum Protocol.
The objective of Gnosis is to provide a framework for several decentralized apps that may serve as sources of data, standards, and forecasting tools in this market.
Gnosis thinks it can create a trustworthy forecasting tool with use cases for decision-makers in a variety of industries, including insurance, government, and finance, by providing access from any party to its platform and gathering public opinion in an unfiltered source.
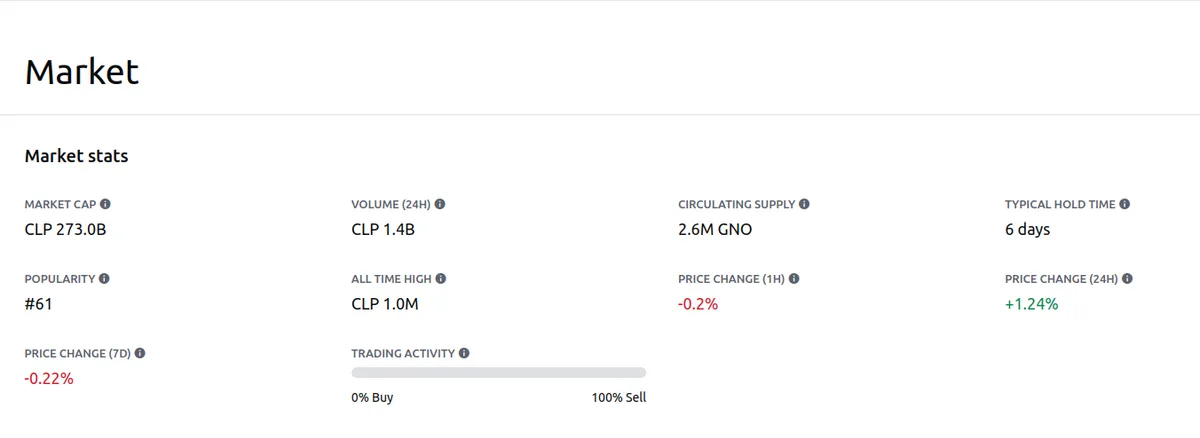
The price of Gnosis has fallen by 0.22% in the past 7 days. The price increased by 1.24% in the last 24 hours. In just the past hour, the price shrunk by 0.20%. The current price is CLP 105,479.58645 per GNO. Gnosis is 89.93% below the all-time high of CLP 1,047,503.8287.
The current circulating supply is 2,579,588 GNO.

METHODOLOGY
To address the recent activity, the total activity plays a vital role, and hence the total transactions, the volume, as well as the users, are considered and hence coming to the timely analysis, Initially, the transaction volume over time with the different addresses are determined along with the users and the transactions in the hop address are charted. Then the total transaction count, with the new users is also determined by aggregating new and active users. The trend of the same is also charted. The total activity in the Gnosis is also determined by considering all the parameters. Furthermore, the transactions are also charted with the label type of Gnosis. The transaction fee and the average fee over time are also calculated. The minimum and the maximum transaction count over time along with the average transaction count over time. The trend in the transaction with the activeness are also charted.
The total users, the transactions as well as the total amount of the users in Gnosis are calculated and charted here.
The total number of users and the transactions in the Hop protocol over time HOP protocol is determined over time. The unique users with the transactions are determined. It is seen that the activity of the users and transactions seems to be usual.
The transaction volume over time with the different addresses are charted here and the it is seen that there is a hike in the transacted volume on October 14 and other than this it seems usual.
The transaction count over time is calculated and charted on the left side. Now it is seen that there is a hike in the transactions done by the active users on October 4 and it is also seen that the same trend is seen on the total users with the highest users on October 5, 2022. This seems unusual as there is a significant increase in the users of both active and new users to a large extend.
The transaction count over time is determined with the addresses of the users and it is seen that the user :0x37efe9b31830653039edc3b212a6e1b882cd46b4 has made the highest transaction than all others and is responsible for the unusual activity.
The trend in the total users over time is determined here and it is seen that there is a hike in the new users as well on October 5 ,2022.
The activity trend of the Gnosis over time is determined over the whole period and it is seen that the recent activity is not the highest but ,considering the recent market trend, the activity is the highest in the past few days but the platform has faced even highest of high orders before.
With the label type, the transaction count does not make much difference but it is seen that chadmin label is involved in transaction on September 28, as this seems unusal with other days.
The transaction fee and the average transaction fee over time is also determined with time, it is seen that there is no big difference in the transaction fee but it is seen that there is a decrease i the average transaction fee from October 04 and also on October 08, 2022.
The average transaction as well as the maximum and the minimum transactions with time and also the average of the Gas fee used are charted here and the same trend of increase in all these parameters are seen here.
It is seen clearly that the hike in the transactions is mainly by the new users who are part of the group which made atleast one transaction.
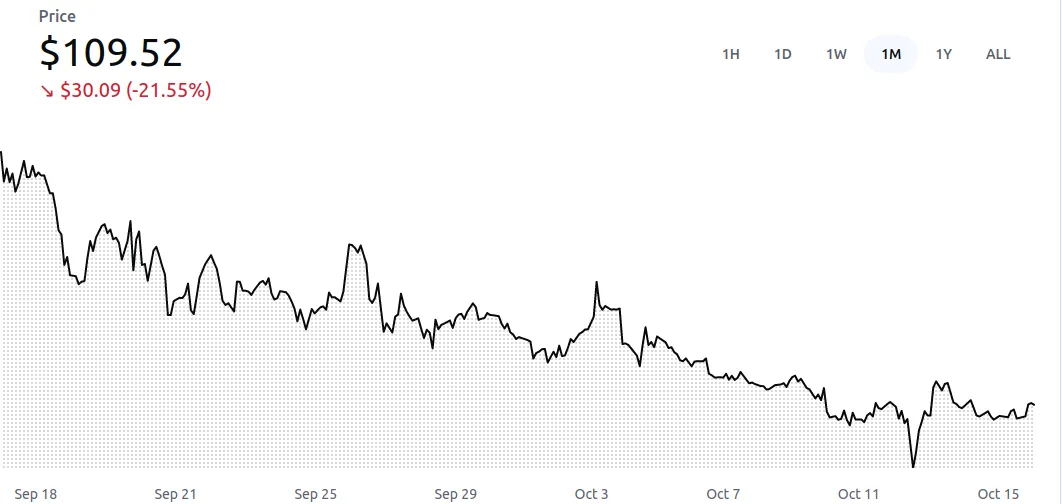
The price chart shows that the price has been decreasing for a month. For reference