Approach
- We use Tx data from
ethereum.core.fact_blocks - We mainly use the column
tx_countandminerto study relation between tx_count and each miner - We use Standard Deviation (SD) value of tx_count to indicate if each miner is likely to mine the block at particular range of tx_count or just randomly mine
- In this work, we only consider miners who has mined more than 1000 blocks, large enough to see their long term behavior
Conclusions
Average Block Tx Count
- Most of miners (59.5%) has Avg block Tx count less than 50, where 35% comes from less than 10
- Followed by 100-150 (20%) > 150-200 (14.6%) > 50-100 (5.87%)
- and there is only 1 miner that has Avg block tx count more than 200
Do certain miners only mine blocks with high/low transaction count?
-
low-tx-count (less than 50) miners only mine low-tx-count blocks, the lower Tx count, the lower SD value.
-
On the other hand, high-tx-count miners do not care much about Tx count of blocks they mine; high SD value.
-
SD value of each miner does not depend on other variable, at least not on Total number of blocks that a miner has mined.
\
Average Block Tx Count
First, we will look at the matrix “Avg Block Tx Count“ of a miner, which is average Tx count of all blocks a miner has mined. This matrix would indicate if, in average, a miner is likely to mine blocks with high or low tx count.
We can see the result on the right, where x-axis is Avg block Tx count range, y-axis is number of miners.
- Most of miners (59.5%) has Avg block Tx count less than 50
- runner up is range of 100-150, which accounts 20% of miners
- 3rd place is 150-200, with 14.6% of miners
- 4th place is 50-100, with 5.87%
- and there is only 1 miner that has Avg block tx count more than 200
We can see in finer-grained detail from distribution graph on the right.
There is steep slope in range of 0-10 Tx count, indicating that many miners really like to mine very low tx count blocks
We hereby define low Tx count as less than 50
For simplicity, the others are high Tx count
Do certain miners only mine blocks with high/low transaction count?
From above, we now get number of miners with their Average block Tx count. Now we want to see that certain miner only mines around their Average value or not
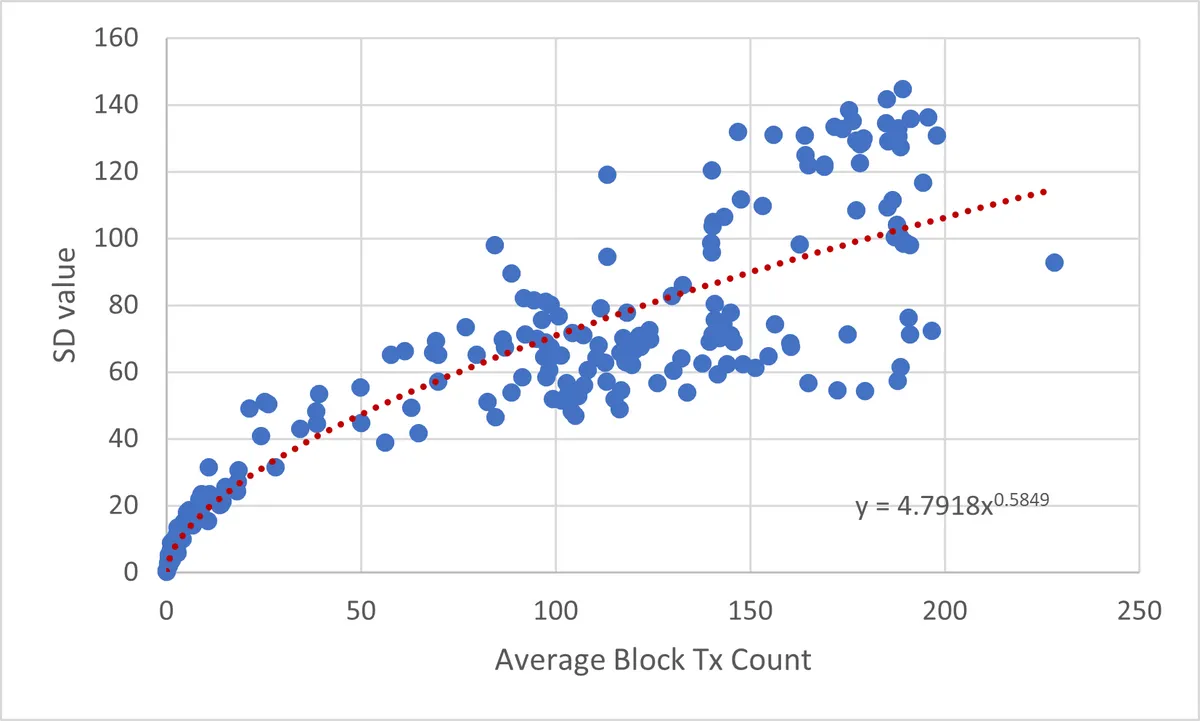
We approach is problem by using Standard Deviation (SD) value read more, which is used to measure dispersion of data. We try to measure dispersion of block Tx count value of every blocks a certain miner has mined. In this context, low SD means that certain miner is likely to mine blocks with Tx count close to his average block Tx count. If SD is high, it means that miner has very large range of block Tx count.
The result is on the right, we can see that there is some trend. Each dot represents certain miner, x-axis represents Average Block Tx count of each miner, y-axis represents its SD value. Clearly, lower Avg block Tx count, lower SD value. It indicates that low-tx-count miners only mine low-tx-count blocks, especially, with miner that has Avg Tx count of less than 20. On the other hand, high-tx-count miners do not care much about Tx count of blocks they mine.
We also try to fit the scattered points of data with a trend line. We found that the data fit well with the equation y = 4.7918x^0.5849, and fit very well with low x-axis, where x is Average Block Tx count of each miner, y-axis is SD value, and fit very well with low x-axis value.
Is there any bias?
We are worried that there will be another variable that contributes the trend above.
Actually, we suspect Total number of blocks that a miner has mined.
We plot that matrix with SD value in the graphs on the right and the far right with shorter x-axis
As depicted, with certain number of blocks mined, there are high range of SD. And there is no trend at all, good grief…